 What Is Bank Fraud? How to Recognize It, Avoid It and Report It
 How to Open a Bank Account for a Minor
 How to Balance a Checkbook
 Retirement Savings: How Much Should I Save Each Month?
How Do Consumer Deposit Rates Track with Fed Rate Changes?
Just about everyone these days has some sort of gut reaction to hearing the words “Fed Rate hike.” The financial crisis of 2007-2008 virtually ensured that fact. Whether excitement, nerves, or hardened skepticism, responses are based on innumerable variables unique to individual circumstances. As depositors, it is important to understand what it means when the Fed changes interest rates and what to expect when it does. Heading into 2016, the FOMC (amazingly) predicted four rate hikes, a forecast that has since been adjusted downward (quite predictably in the minds of many). By understanding how the Fed Rate works and looking at its historical movement relative to actual consumer deposit rates, we can assess what future Fed Rate hikes may mean for depositors in the coming years.
Fed Reserve Funds Rate
The Federal Funds Rate (Fed Rate) is the target rate for lending between depository institutions overnight. The Fed doesn’t actually set the rate at which banks lend to one another; it sets the target rate–the rate at which the Fed believes financial institutions should be lending to one another. Banks, however, negotiate their own rates for overnight loans between institutions, though they usually stay very close to the target. The Fed takes a weighted average of these bank-negotiated rates, thus determining the effective federal funds rate. It initiates change in the rate (in order to match the effective funds rate to the target rate) through either buying or selling government securities or changing the required percentage of assets that financial institutions must hold in reserve.
But why would institutions lend to one another overnight? Great question. Federal law requires financial institutions to maintain a certain percentage of their customers’ money on reserve daily (not used for lending or investing). Money in reserve does not earn interest for the institutions, so they try to stay as close as they can to the reserve limit without going under it. They loan money to one another overnight in order to maintain the correct percentage–those that have larger balances than required at the end of the day lend to those that are lacking.
The Fed Rate Also Affects the Economy
The Fed Rate has been used for decades to control growth of the American economy through managing inflation, fighting recession, and/or spurring economic growth. It reached its peak in the early 80s, nearing 20% during a highly inflationary period. On the opposite end of the spectrum, until December of 2015, the Fed Rate had a nearly eight-year run of a historically low 0–.25%.
Though it may take months or years for the economy to fully feel the effects of a Fed Rate change, consumers are definitely impacted. A change in the Fed Rate (whether contractionary or expansionary) affects consumers in the rates they pay for borrowing and in the rates gained through deposit products. Financing, credit cards, mortgages, and deposit products are all tied to the rate in one way or another.
A low Fed Rate environment, like the one currently in place, generally means that spending (borrowing) is less expensive, thus encouraging businesses and individuals to borrow and thereby (hopefully) strengthening the economy. Lowered rates are typically used to combat recession and spur economic growth. That same environment, while conducive to lending, is less conducive to saving. While loan rates are low, so are deposit rates, so the returns on deposit products suffer (as many of our readers know all too well). A high Fed Rate environment produces the opposite effect–deposit rates are high, which encourages saving. However, loan rates are also high, which can discourage business and individual borrowing. This is a scenario historically brought about to counter high inflation.
History of the Fed Rate
The Fed Rate has fluctuated a great deal over the years, beginning a steady climb in the mid-50s to a peak in the early 80s and declining steadily up through the current historic low. The following graphic is an overview of the changes throughout that entire time:

Note the shaded spaces on the chart, which indicate recessions in the U.S. Each recession is marked with at least one sharp drop in the rate. For the most part, consumer rates tend to follow right along with the Fed Rate. A few exceptions may be seen, however. The following chart overlays the average rate of 6 Month CDs over the effective federal funds rate for comparison:

As you can see, over the long run, and most often in the short run, changes in the Fed Rate match up with changes in the 6 Month CD rate. One of the most glaring exceptions is around 2008. The Fed Rate shows a sharp drop, yet the 6 Month CD rate spikes dramatically. Here is a closer view:
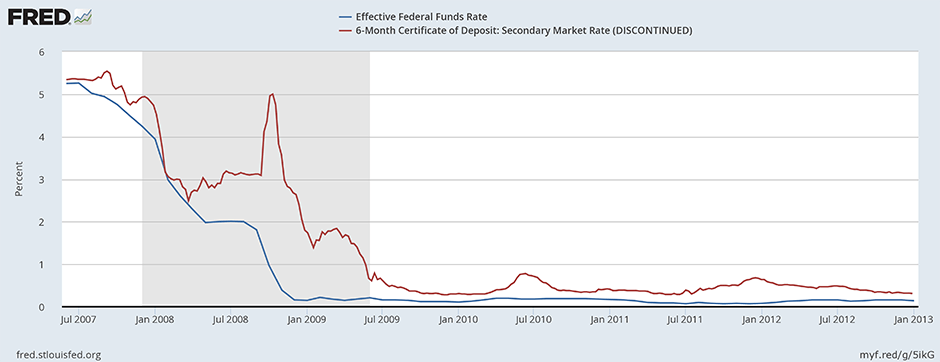
The 6 Month CD rate stuck relatively close to the Fed Rate as it began to decrease mid-2007. In early 2008, however, the two rates diverged, as the Fed Rate continued to fall and the 6 Month CD rate spiked rather dramatically. Before the 2008 financial crisis, a surge in inflation (partly due to a surge in gas prices) worried the Fed and caused many to believe the Fed would be raising rates. That discouraged savers from opening CDs which put upward pressure on CD rates. Also, the financial crisis forced banks to end securitization, which increased the demand for deposits at banks. This was another factor that contributed to the spike in the 6 Month CD rate.
Longer term CDs also followed a similar pattern during that same time period around 2008. Knowing that the Fed Rate had been falling, which historically meant that deposit rates would also fall, the diversion of rates from the normal pattern created a unique situation for depositors. The brief spike in the CD rate and the historical knowledge that the disparity between the Fed Rate and the CD rate would eventually correct created an opportunity for savers to lock into longer term CDs at higher rates, expecting that they would soon fall. Locking into the rates during that spike (5-5.5% on long-term CDs) meant far higher long-term returns than with the short-term rates that plummeted within a few months.
Rising Rates
The current rate environment being what it is, we also thought it helpful to look back at other similar periods of time during which the Fed Rate was flat for an extended time and was then raised. Understanding how deposit rates responded to the rate increase during those times can help depositors know what to expect moving forward if the Fed considers raising rates again. Two such historical periods were in the mid-90s and early 2000s. Take a look at the Fed Rate and 6 Month CD rate movement in 1992-1995:

The Fed Rate was on a downward trajectory heading into Jan 1992 and fell consistently throughout the year. Leveling off in early 1993, it fluctuated very little throughout the year, hovering around 3%. Apart from a couple of short-lived rate spikes, the 6 Month CD rate followed closely on the heels of the Fed Rate through 1992 and 1993, hovering between 3-3.5%. January 1994 saw an upturn in the Fed rate, and the 6 Month CD rate turned northward quickly thereafter at the beginning of February.
A second notable period of rather flat rates leading into a rise in rates was in 2003 and 2004:
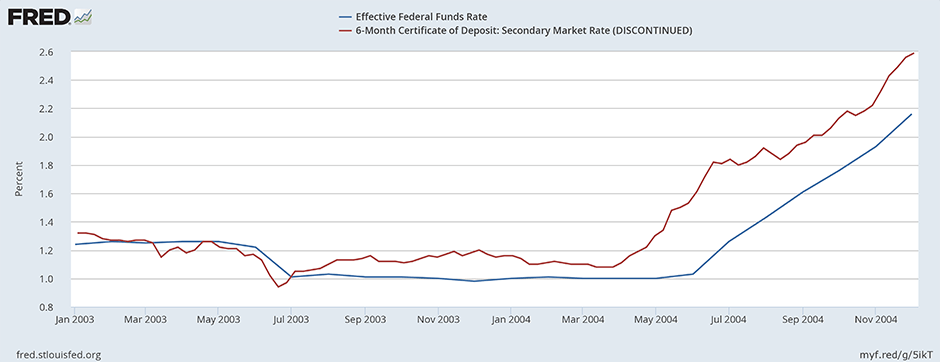
Similar to the previous time period, decreasing rates led into the year, reaching a low point of about 1% on the Fed Rate in July 2003 and hovering there for about a year. June of 2004 produced an upward turn in the Fed Rate, but this time it was actually preceded by an upturn in the 6 Month CD rate, which began to climb in April of 2004, two full months in advance of the Fed Rate increase. By June 2004, when the Fed Rate had only jumped from 1 % to 1.03 %, the 6 Month CD rate had risen from 1.11% to 1.61%. During the period of increase, the CD rate continually lead the Fed Rate by around .5%, a healthy advantage considering such low rates.
Another notable time period came in 1999 and 2000. A three-year period of relatively flat rates followed by a sharp decline led up to an extended rate increase:
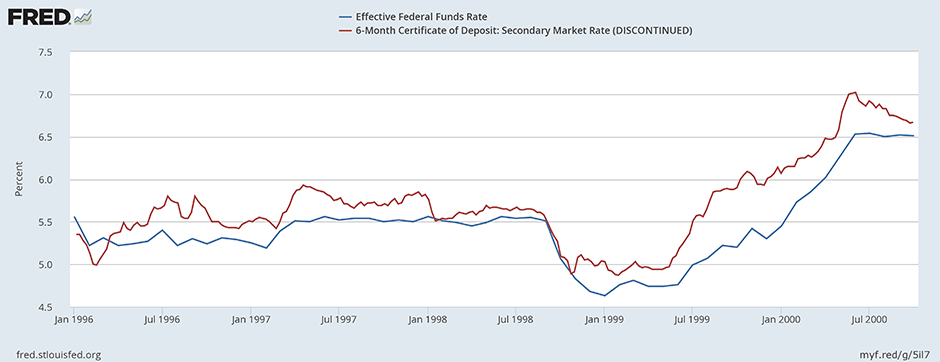
The CD rate increase preceded the Fed Rate move in this case, and kept a healthy lead as both rates headed northward. Similar to the 2003-2004 time period, the CD rate hovered around .5% or so higher than the Fed Rate.
What Should We Expect?
We are currently in a historically unprecedented rate environment, so predicting what may happen next is tricky. The three time periods of increasing rates that we considered here yielded different results, one with the CD rate beginning to rise after the Fed Rate hike and two with them beginning to rise slightly before. In any case, the advent of a deposit rate increase does typically occur quite close to the beginning of a Fed Rate increase. Furthermore, as we saw in the above examples, a rising Fed Rate means deposit rates that are quickly rising at an even higher pace, which should be an encouraging historical trend for savers eagerly awaiting a turn in deposit rates.
As mentioned previously, the FOMC predicted four rate hikes for 2016, but it seems that plan has been tossed out the window. Predicting what comes next would be difficult, even without the historically notable rate environment. However, if the Fed does move forward with any of the predicted increases in the next few years, we can expect deposit rates to start moving around the same time and likely to outpace the Fed increases, which is a promising and exciting prospect for any depositor who hasn’t become too jaded from this most recent period to even believe it’s a possibility.