 What Is Bank Fraud? How to Recognize It, Avoid It and Report It
 How to Open a Bank Account for a Minor
 How to Balance a Checkbook
 Retirement Savings: How Much Should I Save Each Month?
How Did The Financial Crisis Affect Credit Union Market Share?
The following post is from our analyst, Rodney, and is part of an ongoing series of articles that seek to take a deeper and more concerted look into what we can glean from our proprietary depository banking data set.
"For-profit or not-for-profit?" That is the question. Within the last decade, that question has affected the banking industry, or at least many consumers have hoped it would. From the financial collapse of 2008 to the Occupy Wall Street movement in 2011, many have been questioning the role of profit within the banking industry, believing that the livelihoods of millions are at stake. We thought it interesting, then, to look back and see how the for-profit/not-for-profit conversation has actually affected the banking landscape over time.
Before the Financial Crisis
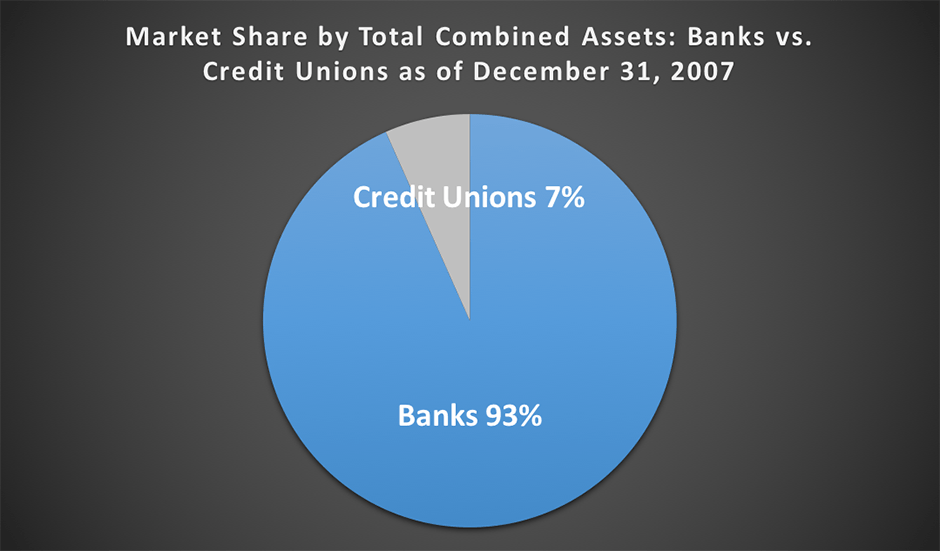
Before the collapse, to no one’s surprise, for-profit banks held the lion’s share of all banking assets. According to the FDIC and NCUA, banks boasted a whopping $10.7 Trillion in assets versus the $770 Billion held by credit unions in the final quarter of 2007:
In December of 2007, 7,772 banks were in operation and averaged almost $1.4 Billion in total assets per institution, as opposed to 8,268 credit unions with an average of just over $93 Million in total assets per institution. In the final few months of 2007, hints of coming trouble emerged on the heels of a rash of sub-prime lending and adjustable-rate mortgages as a part of the housing bubble that had peaked in 2004. The concern about lax lending standards, so-called "predatory lending," and federal deregulation, along with a host of other contributing factors, led many to believe that trouble was brewing for both the U.S. and world economies. The markets began to respond, with the Dow reaching its peak in October 2007 and the nation’s economy plunging into recession by December of that same year.
The Outcry Against For-Profit Institutions
The first quarter of 2008 proved those expecting trouble right, and the beginning of a new narrative for the financial system in the U.S. began, banking included. Mortgage defaults, foreclosures, and bankruptcies began piling up in the wake of the subprime mortgage debacle, and the first in a series of massive bailouts for failing banks began in March and continued throughout the following months, reaching a crescendo in the fall of that year. Major financial institutions, ones considered "too big to fail" for the sake of U.S. and world economies, succumbed to their own involvement in subprime lending and subsequently received billion-dollar bailouts from the U.S. government, which became a regular headline in the major news cycles.
In response to the continual bailouts and ever-worsening recession, a public outcry arose, particularly as it pertained to the huge payouts for Wall Street and banking executives in the very institutions that were receiving Federal dollars. The American public–at least large swaths of it–was incensed. "Profit" became an honorary four letter word in many circles, especially when tied to the institutions at the center of the recession that was causing financial crisis, bankruptcy, and near-record unemployment levels. People were fed up with the status quo approach that had rewarded and incented such reckless behavior, and they were looking for a way to express their anger and change the system that led to the problem at hand.
Their reaction was to bail out of the major for-profit banks they blamed for the state of the economy and the pain of the recession and move their money into smaller community banks and credit unions.
Bank of America, Bank Transfer Day, and the Occupy Movement
Fast-forward a few years to 2011, and much of the American public was still looking for a way to change the system and hold Wall Street accountable for the continuing recession. Rumors began to circulate about a lengthy protest in the form of an occupation meant–in part–to address banking reform, and "We are the 99%" began to find its way into publications and onto sandwich boards and protest signs.
The Occupy Wall Street movement kicked into high gear on August 17, 2011, as protestors literally set up camp in New York’s Zuccotti Park. Barely more than a month later, on September 29, 2011, fuel was poured on the fire as Bank of America announced a new $5.00 monthly fee for debit card transactions, ostensibly in order to help offset its associated costs. Consumers and protesters responded with a renewed call for people to move their money from for-profit megabanks to not-for-profit credit unions.
Bank Transfer Day was planned for November 5, 2011, and consumers were urged to move their dollars to credit unions either by or on that day. Subsequent reports claimed that between September 29 and November 5, 2011 approximately 440,000 people moved nearly $5 Billion into Credit Unions , with more than 40,000 of those new members opening accounts on November 5.
Effect on Credit Union Growth?
Looking back now, the question is whether or not actual change was effected by these efforts. We dug into the NCUA and FDIC data within our database to look for an answer to that question, and the results were rather surprising.
From 2003 (before the peak of the housing market boom) through the end of 2015, credit unions were marked by steady growth:
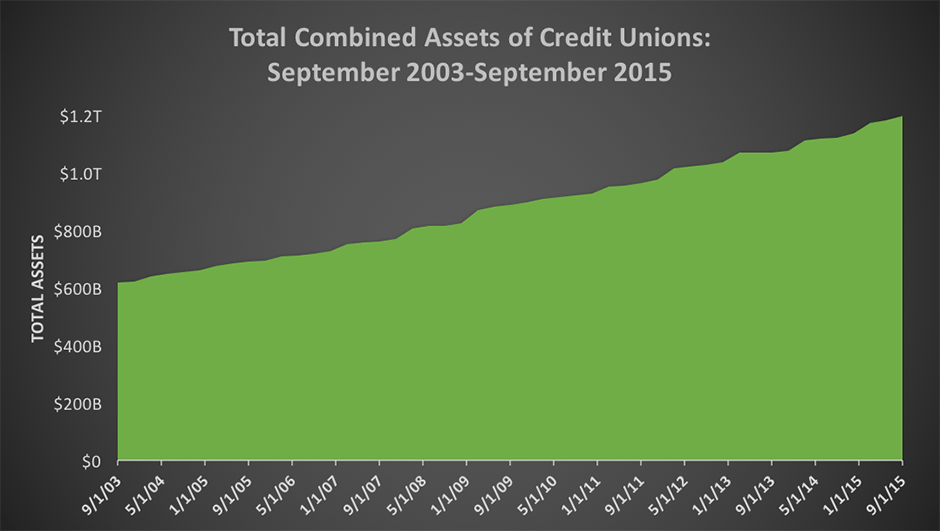
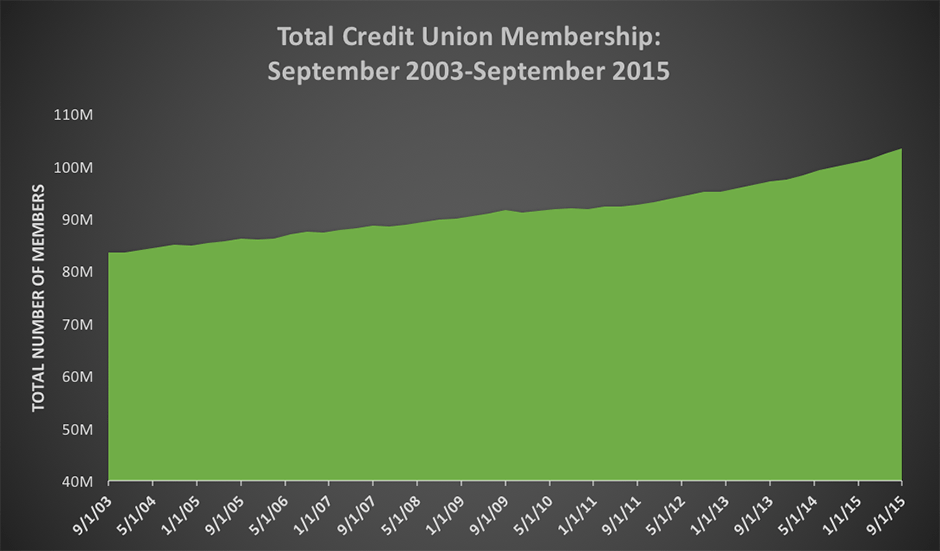
Over that time, the total assets of credit unions nearly doubled, increasing from $610 Billion to nearly $1.2 Trillion and yielding a compounded annual growth rate of 5.76%. Likewise, the total membership in credit unions increased from approximately 83 Million to just over 103 Million, a growth rate of 1.86%:
The growth of credit unions throughout this time is undeniable, but whether or not said growth is attributable to the above narrative or accomplished any of the goals of those involved in the anti-banking movements remains to be seen. The following chart zooms in on the asset growth of credit unions between the end of 2007 and the end of 2012 and includes the demarcation of a few key defining dates during that time period:
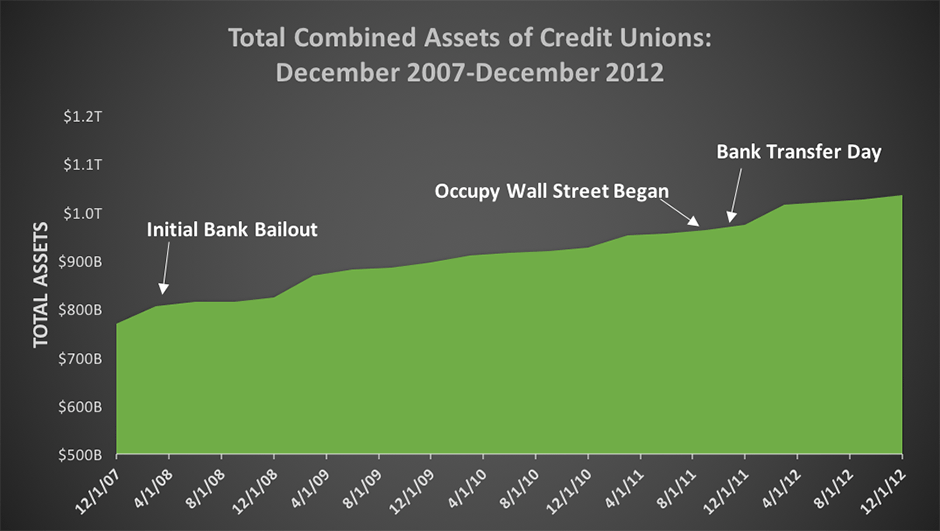
This detailed look does not reveal a readily apparent positive net gain in assets from the orchestrated responses to the financial crisis as it pertains to making the move to not-for-profit institutions. The sustained growth of assets continues similarly to what occurred since 2003, but no sharp upticks in credit union growth are otherwise visible on or around those high-profile movements and events. That is not to say that these emphases did not have any effect on the long-term growth of credit unions, but that no evidence is seen of an immediate, otherwise-inexplicable impact.
Another interesting trend in this storyline can be seen in the total number of credit unions in operation over this time:
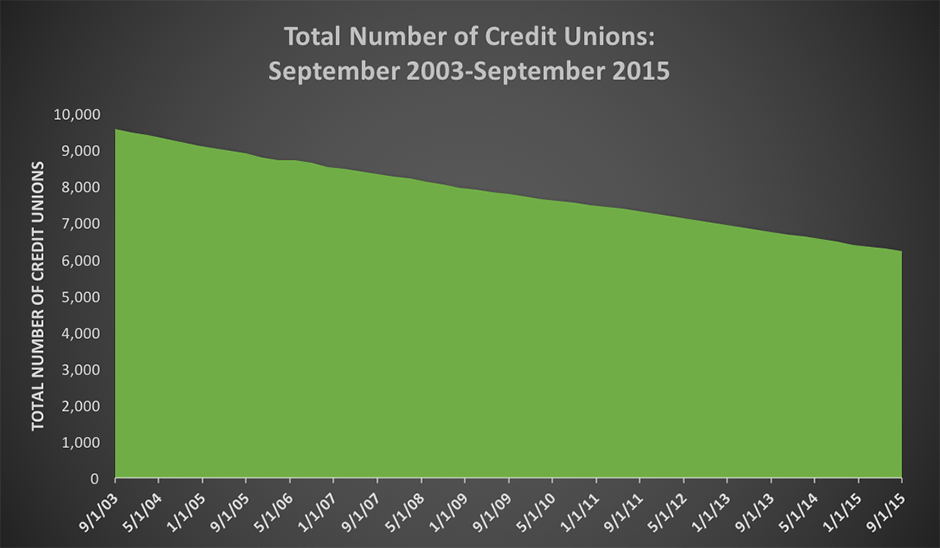
While assets and membership grew steadily between 2003 and 2015, the total number of credit unions actually declined. June 2003 saw a total of 9,646 credit unions in operation, while only 6,216 remained in September 2015. As evidenced, the industry began a significant consolidation during this period, with the larger credit unions growing larger, while many of the smaller credit unions either shrank or disappeared altogether.
What About the Banks?
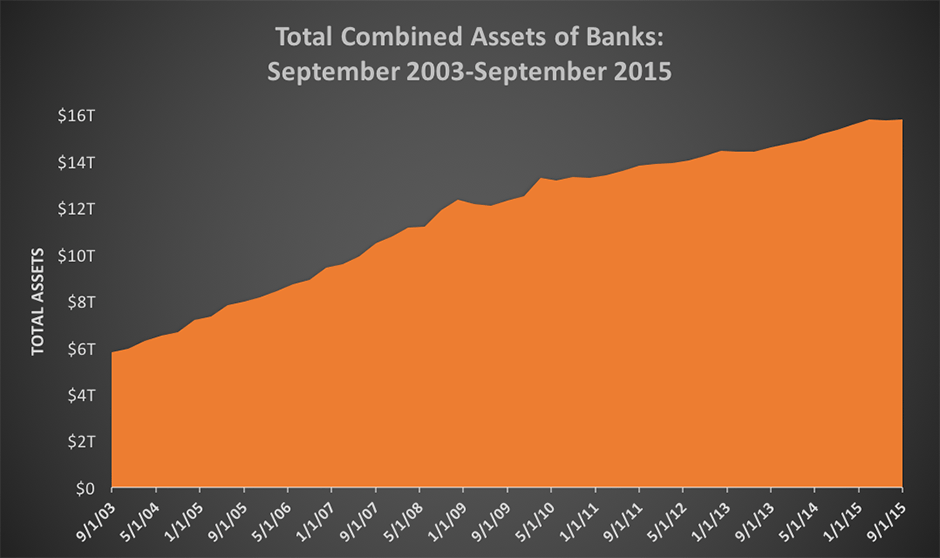
As important context for gauging the expansion of credit unions in the wake of the financial crisis, we can also examine the growth trends of banks over this period. If the purpose of the movements in response to the financial crisis was to pull consumer deposits from banks to credit unions, then their effectiveness could be gauged both in the growth of credit unions and an assumed (relative) decline in banks (though, admittedly, the unprecedented efforts of the Fed over this period muddle this analysis). The following image charts the course of bank asset growth from 2003-2015:
And the following chart displays the total number of institutions:
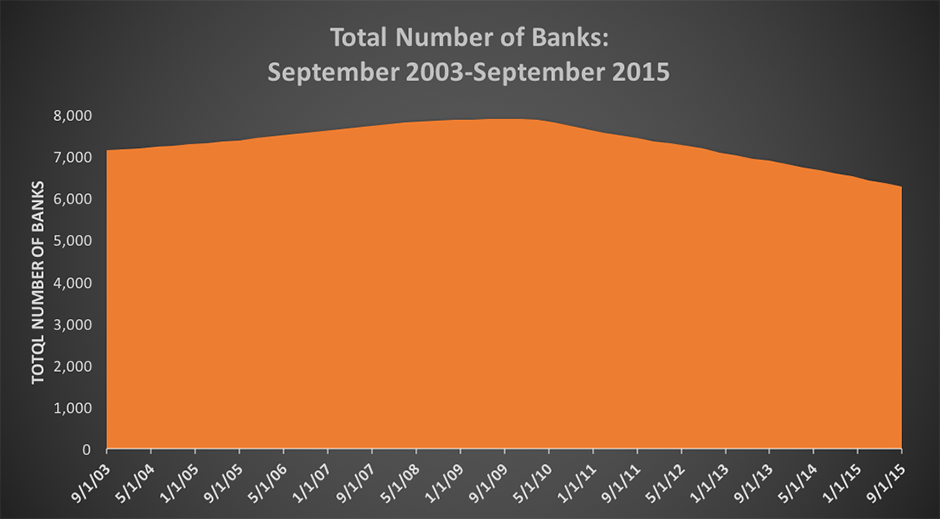
As you can see from the assets chart, banks posted a fairly steady–and impressive–increase in total assets, nearly tripling over the charted time period. As for the total number of banks, though a slight increase can be seen for the first half of the period, a total net loss of 846 banks occurred as failures and consolidation began hitting the banks in 2009 and beyond.
Maybe the most telling statistic, however, in the question of how much real measurable change has occurred in the system may be seen in a return to the initial chart showing market share. We began this article with a look at market share at the end of 2007 before the financial crisis. The following graphic takes a look at the same measurable data, but from September 2015:
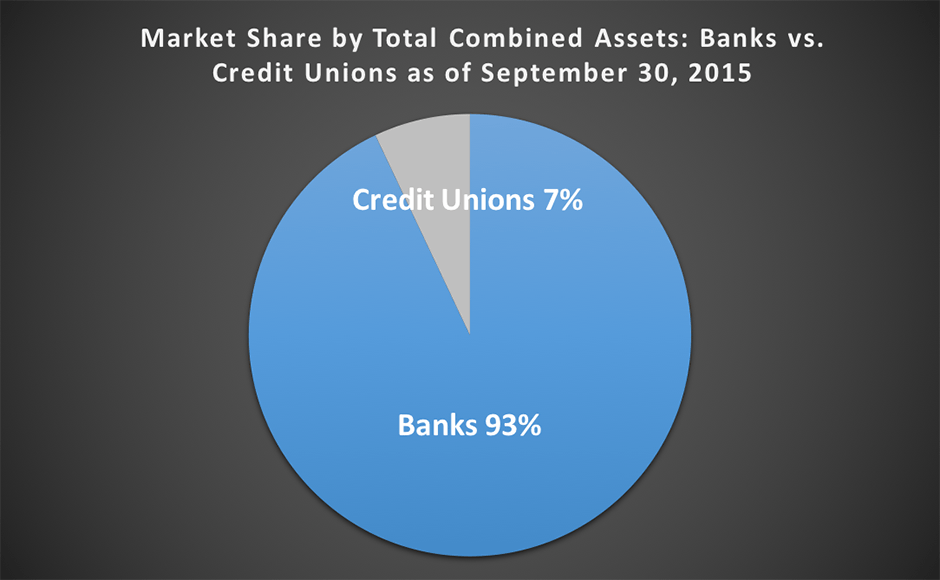
That’s correct–no measurable change exists. Though the actual dollar numbers ($15.8T now vs. $10.7T then for banks, and nearly $1.2T now vs. $770B then for credit unions) are much higher than those from 2007, the percentage of market share in the banking industry was the same in 2015 as it was in 2007.
’Profit or Not-for-Profit?’ More like ‘Go Big or Go Home'
"Profit or not-for-profit?" That may still be the question. In light of the current trends, and barring a major change, it seems that a more appropriate expression might be, "go big, or go home." Based on recent data and industry projections, larger institutions may grow larger (both banks and credit unions), and the smaller may shrink or disappear. As for not-for-profit institutions taking significant market share from their for-profit counterparts, that remains to be seen. Again, however, following current trends, it seems rather unlikely any time in the near future.