 Financial Planner vs. Financial Advisor: Is There a Difference?
 Step-Up CDs: What They Are and How They Work
 What Is a Rollover IRA? Understanding Rollover Rules
 CD Early Withdrawal Penalty: Should You Pay It?
Retirement Statistics You Should Know
Post a Comment
POSTED
BY DepositAccounts
Written by Dragana Filipovic and Dan Shepard | Published on 10/21/2024
Americans believe they need to save an average of $1.8 million for retirement, according to Charles Schwab, and they expect it to last 23 years. As early as age 62, you can start to receive some Social Security benefits to supplement retirement income.
DepositAccounts has compiled retirement statistics to give context and provide comparisons. Here’s what we found.
On this page
Key retirement statistics
- The average 401(k) balance in the second quarter of 2024 was $127,100, according to Fidelity. That’s up 13% from $112,400 in Q2 2023 and 20% from $106,000 in Q2 2019.
- The average 401(k) employee contribution in Q2 2024 was $2,560, according to Fidelity. That’s up from $2,390 in Q2 2023 and $2,030 in Q2 2019.
- The average savings rate among 401(k) participants in Q2 2024 was 14.1%, according to Fidelity. That’s up from 13.9% in Q2 2023 and 13.5% in Q2 2019.
- Average household retirement account balances as of 2022 were highest in Massachusetts ($448,500), Hawaii ($433,700) and New Jersey ($376,700), according to the U.S. Census Bureau Survey of Income and Program Participation (SIPP).
- 68% of American workers in 2024 feel somewhat or very confident in their ability to have enough money in retirement, according to the Employee Benefit Research Institute (EBRI). That’s up from 64% in 2023. And 21% feel very confident, up from 18% in 2023.
Important definitions/explanations
We discuss various types of retirement plans or phrases, so here are a few important retirement statistics definitions and explanations:
- 401(k): Tax-advantaged employer-sponsored savings plan that allows employees to contribute part of their wages to an individual account.
- 401(k) savings rate: Includes both employee and employer 401(k) contributions.
- Individual retirement account (IRA): Tax-advantaged savings plan that you open with a bank or brokerage.
- 403(b): Retirement plan offered by public schools and certain tax-exempt organizations.
- Roth 401(k): Allows employees to contribute after-tax dollars.
- Medicare Part A and B and Part D: Medicare Part A and B cover expenses such as hospital stays, doctor visits and services, while Part D covers prescription drugs.
- Keogh: Tax-deferred plan for self-employed people and unincorporated businesses to sponsor retirement plans. The IRS notes the term is seldom used.
Retirement numbers, now and then
- The average individual retirement account (IRA) balance in the second quarter of 2024 was $129,200, according to Fidelity. That’s up 14% from $118,800 in Q2 2023 and 17% from $110,400 in Q2 2019.
- The average IRA contribution in Q2 2024 was $2,200, according to Fidelity. That’s up from $2,000 in Q2 2023.
- The average 403(b) balance in Q2 2024 was $114,700, according to Fidelity. That’s up 12% from $102,400 in Q2 2023 and 29% from $88,600 in Q2 2019.
.png)
- The average savings rate among 403(b) participants in Q2 2024 was 11.8%, according to Fidelity. That’s up from 11.7% in Q2 2023 and 11.3% in Q2 2019.
- 79.9% of 401(k) account participants received an employer contribution in Q2 2024, according to Fidelity. That’s up from 79.5% in Q2 2023 and 72.7% in Q2 2019.
- The average employer match for traditional 401(k) plans is 6.61% in 2024, according to SHRM, versus 6.50% for Roth 401(k) plans.
- The average retirement account balance for U.S. households was $333,940 in 2022, according to the Federal Reserve Survey of Consumer Finances (SCF). That’s a 12.9% increase from $295,740 in 2019.
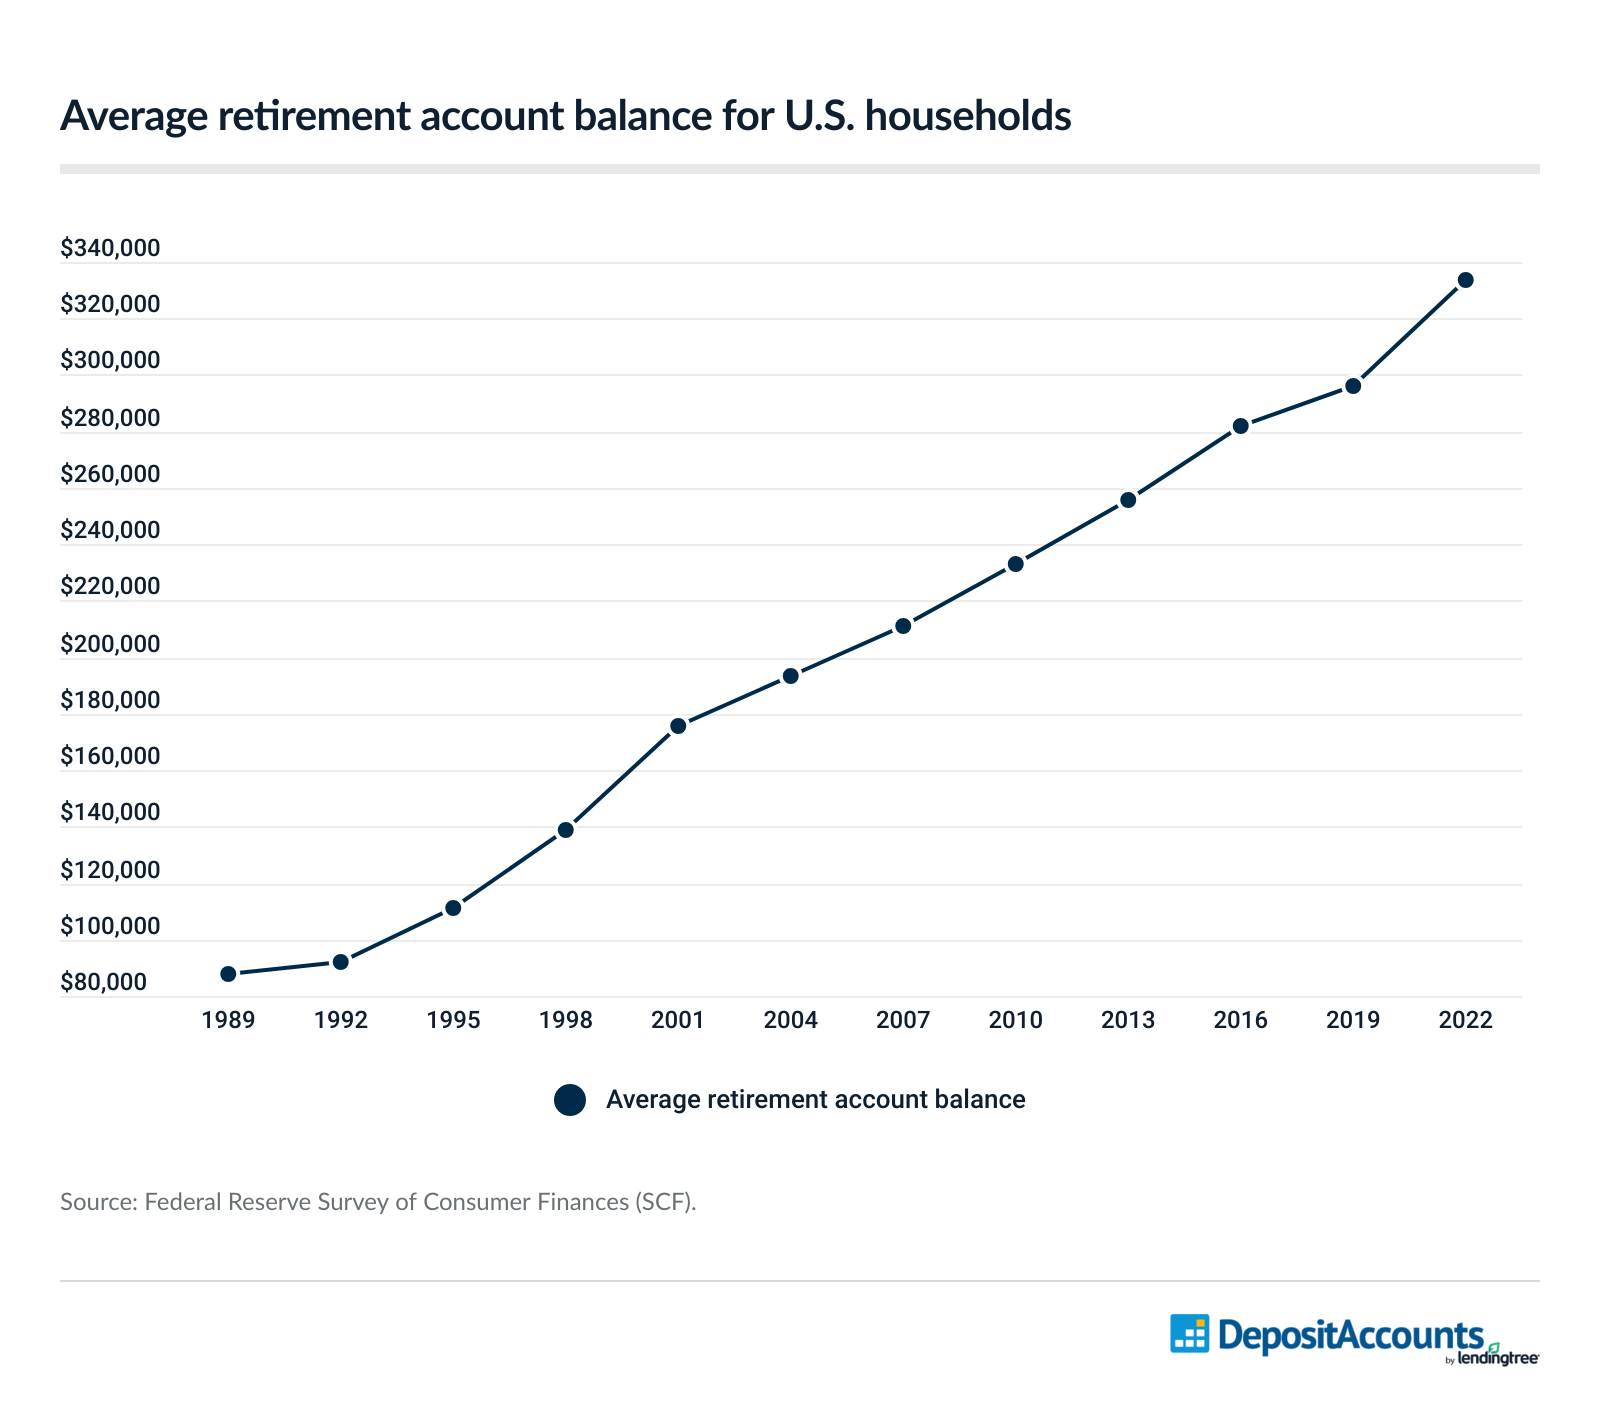
- The median retirement account balance for U.S. households was $87,000 in 2022, according to the Federal Reserve SCF. That’s a 15.5% increase from $75,350 in 2019.
- 54.4% of U.S. households had at least one retirement account in 2022, according to the Federal Survey SCF. That’s a 7.5% increase from 50.6% in 2019.
- In 2024, a 65-year-old retiree enrolled in traditional Medicare Part A and B and Part D needs an average of $165,000 to cover health care and medical expenses in retirement, according to Fidelity. This doesn’t include expenses like over-the-counter medicine and dental and vision care. This is up nearly 5% from $157,500 in 2023.
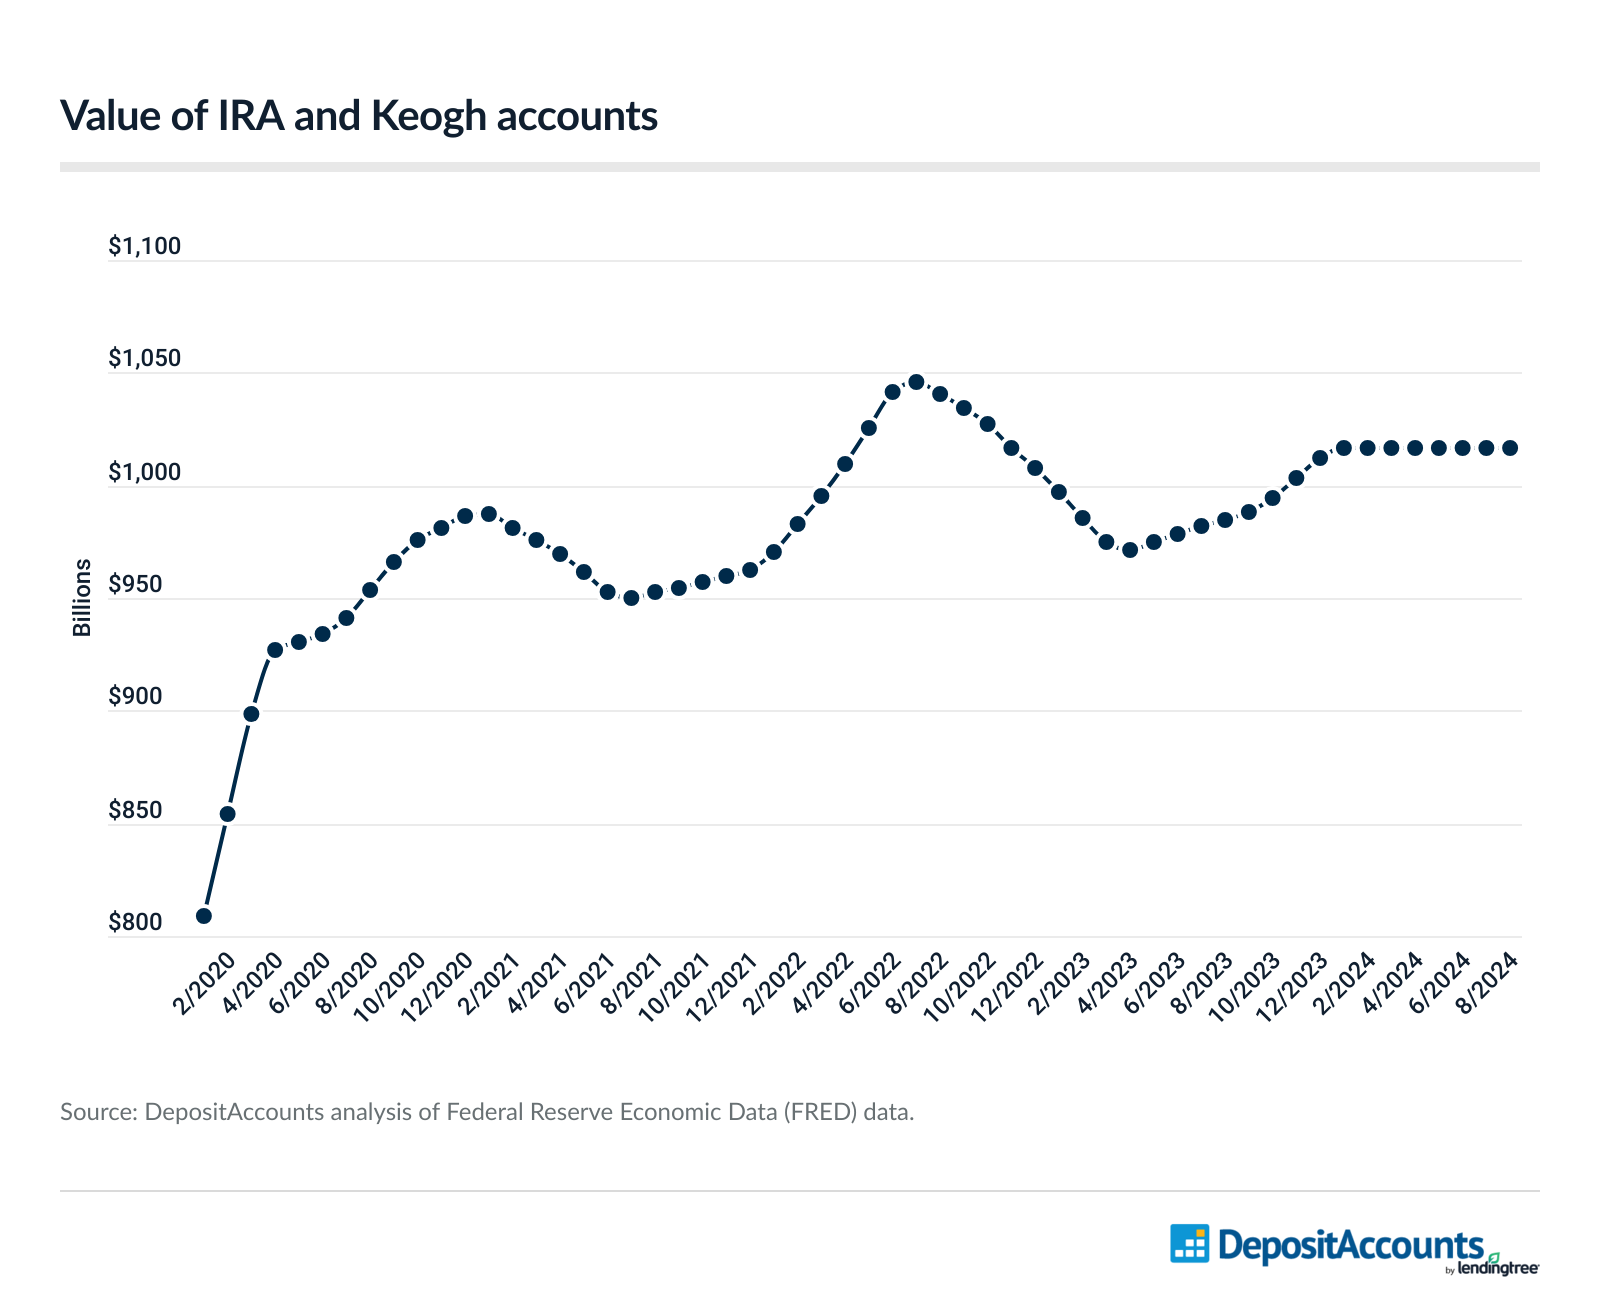
- The total value of IRA and Keogh accounts as of August 2024 was $1.02 trillion, according to Federal Reserve Economic Data (FRED). That’s compared to $985.0 billion in August 2023 — an increase of 3.2%. At their peak in July 2022, they had a total value of $1.05 trillion.
| Value of IRA and Keogh accounts | |
| Month | Value |
| January 2020 | $808.7 billion |
| February 2020 | $853.7 billion |
| March 2020 | $898.8 billion |
| April 2020 | $927.3 billion |
| May 2020 | $930.5 billion |
| June 2020 | $933.8 billion |
| July 2020 | $941.0 billion |
| August 2020 | $953.7 billion |
| September 2020 | $966.4 billion |
| October 2020 | $975.7 billion |
| November 2020 | $981.2 billion |
| December 2020 | $986.8 billion |
| January 2021 | $986.9 billion |
| February 2021 | $981.4 billion |
| March 2021 | $975.9 billion |
| April 2021 | $969.2 billion |
| May 2021 | $961.2 billion |
| June 2021 | $953.1 billion |
| July 2021 | $949.9 billion |
| August 2021 | $952.3 billion |
| September 2021 | $954.7 billion |
| October 2021 | $957.1 billion |
| November 2021 | $959.8 billion |
| December 2021 | $962.4 billion |
| January 2022 | $970.3 billion |
| February 2022 | $982.7 billion |
| March 2022 | $995.2 billion |
| April 2022 | $1.01 trillion |
| May 2022 | $1.03 trillion |
| June 2022 | $1.04 trillion |
| July 2022 | $1.05 trillion |
| August 2022 | $1.04 trillion |
| September 2022 | $1.03 trillion |
| October 2022 | $1.03 trillion |
| November 2022 | $1.02 trillion |
| December 2022 | $1.01 trillion |
| January 2023 | $996.6 billion |
| February 2023 | $985.6 billion |
| March 2023 | $974.6 billion |
| April 2023 | $971.0 billion |
| May 2023 | $974.9 billion |
| June 2023 | $978.8 billion |
| July 2023 | $982.1 billion |
| August 2023 | $985.0 billion |
| September 2023 | $987.8 billion |
| October 2023 | $994.2 billion |
| November 2023 | $1.00 trillion |
| December 2023 | $1.01 trillion |
| January 2024 | $1.02 trillion |
| February 2024 | $1.02 trillion |
| March 2024 | $1.02 trillion |
| April 2024 | $1.02 trillion |
| May 2024 | $1.02 trillion |
| June 2024 | $1.02 trillion |
| July 2024 | $1.02 trillion |
| August 2024 | $1.02 trillion |
| Source: DepositAccounts analysis of Federal Reserve Economic Data (FRED) data. | |
- 22.0% of retirement-age adults were still working in March 2024, according to LendingTree, down from 22.5% in March 2022. Americans’ life expectancy is 77.5 years, according to Centers for Disease Control and Prevention (CDC) 2022 estimates.
Retirement perception, now and then
- 74% of retirees in 2024 are very or somewhat confident they have enough money saved for retirement, according to EBRI, up from 73% in 2023. And 28% feel very confident, up from 27% in 2023.
- 74% of retired Americans in 2024 say they have enough money to live comfortably, according to Gallup, down from 77% in 2023.
- The average age at which 401(k) plan participants expect to retire is 65, according to Charles Schwab, down from 66 in 2023.
- 61% of 401(k) plan participants feel they need professional financial advice, according to Charles Schwab, up from 55% last year.
Retirement by state
- Louisiana ($128,900), Mississippi ($131,500) and Arkansas ($143,600) had the lowest average household retirement account balances as of 2022, according to the U.S. Census Bureau SIPP.
- Between 2021 and 2022, average household retirement account balances grew the most in Kansas (60.2%), Nebraska (53.8%) and Mississippi and Minnesota (both at 22.4%), according to the U.S. Census Bureau SIPP.
| Change in average household retirement account balances by state, 2021 to 2022 | ||||
| Rank | State | Average household retirement account balance, 2021 | Average household retirement account balance, 2022 | Difference (%) |
| 1 | Kansas | $197,600 | $316,600 | 60.2% |
| 2 | Nebraska | $163,300 | $251,100 | 53.8% |
| 3 | Mississippi | $107,400 | $131,500 | 22.4% |
| 3 | Minnesota | $301,100 | $368,400 | 22.4% |
| 5 | Georgia | $183,300 | $214,500 | 17.0% |
| 6 | Washington | $288,700 | $330,900 | 14.6% |
| 7 | Florida | $251,900 | $287,200 | 14.0% |
| 8 | Massachusetts | $403,400 | $448,500 | 11.2% |
| 9 | South Carolina | $264,400 | $274,500 | 3.8% |
| 10 | Utah | $261,900 | $270,800 | 3.4% |
| 11 | Wisconsin | $306,600 | $310,700 | 1.3% |
| 12 | Idaho | $189,400 | $190,600 | 0.6% |
| 13 | Colorado | $329,500 | $321,200 | -2.5% |
| 14 | Maryland | $381,500 | $368,700 | -3.4% |
| 15 | Connecticut | $371,100 | $351,800 | -5.2% |
| 15 | Arizona | $385,500 | $365,300 | -5.2% |
| 17 | Alabama | $175,100 | $165,500 | -5.5% |
| 18 | Oklahoma | $237,100 | $222,900 | -6.0% |
| 19 | Texas | $297,300 | $278,600 | -6.3% |
| 20 | Kentucky | $307,000 | $278,800 | -9.2% |
| 21 | Virginia | $341,300 | $307,600 | -9.9% |
| 22 | Arkansas | $160,400 | $143,600 | -10.5% |
| 23 | Hawaii | $487,300 | $433,700 | -11.0% |
| 24 | California | $340,600 | $301,500 | -11.5% |
| 25 | Pennsylvania | $289,800 | $255,500 | -11.8% |
| 26 | Oregon | $339,700 | $299,300 | -11.9% |
| 27 | Indiana | $218,800 | $190,700 | -12.8% |
| 28 | Missouri | $233,900 | $203,800 | -12.9% |
| 29 | North Carolina | $338,300 | $294,400 | -13.0% |
| 30 | New Jersey | $435,700 | $376,700 | -13.5% |
| 31 | Ohio | $368,500 | $315,900 | -14.3% |
| 32 | Montana | $319,200 | $270,900 | -15.1% |
| 33 | Tennessee | $242,300 | $201,200 | -17.0% |
| 34 | Michigan | $365,800 | $297,900 | -18.6% |
| 35 | New Mexico | $219,900 | $169,200 | -23.1% |
| 36 | New York | $379,500 | $275,700 | -27.4% |
| 37 | Illinois | $427,700 | $298,000 | -30.3% |
| 38 | Nevada | $445,000 | $286,600 | -35.6% |
| 39 | Louisiana | $203,200 | $128,900 | -36.6% |
| 40 | West Virginia | $288,600 | $174,200 | -39.6% |
| 41 | Iowa | $387,800 | $228,900 | -41.0% |
| Source: U.S. Census Bureau SIPP. Notes: Total includes 401(k), IRA, Keogh and thrift savings plan accounts. Alaska, Delaware, the District of Columbia, Maine, New Hampshire, North Dakota, Rhode Island, South Dakota, Vermont and Wyoming are omitted for not having both 2021 and 2022 data. | ||||
- The states with the highest percentage of workers with access to employer-provided retirement plans as of 2021 were Iowa (57.9%), Idaho (57.2%) and Montana (55.4%), according to the Economic Innovation Group (EIG).
- Florida (33.1%), Georgia (36.6%) and Rhode Island (38.5%) had the lowest rates of workers with access to employer-sponsored retirement plans as of 2021, according to EIG.
Related: How much you’ll spend in your retirement years, by state
Retirement disparities
Generations/ages
- The average 401(k) balance among baby boomers (ages 60 to 78 in 2024) in the second quarter of 2024 was $242,200, according to Fidelity. That’s ahead of Gen Xers (ages 44 to 59) at $182,100, millennials (ages 28 to 43) at $62,000 and Gen Zers (18 to 27) at $12,000.
- The average savings rate among baby boomer 401(k) participants in Q2 2024 was 17.0%, according to Fidelity. That’s ahead of Gen Xers at 15.2%, millennials at 13.3% and Gen Zers at 11.0%.
- 43% of 401(k) plan participants in 2024 think they’ll very likely achieve their retirement goals, according to Charles Schwab, with Gen Zers being the most optimistic at 50% and Gen Xers and baby boomers being the least optimistic at 40%.
- Americans 65 and older had an average Vanguard account balance of $272,588 as of 2023, according to Vanguard. That compares with $244,750 among 55-to-64-year-olds, $168,646 among 45-to-54-year-olds, $91,281 among 35-to-44-year-olds, $37,557 among 25-to-34-year-olds and $7,351 among those younger than 25.
- Americans 65 to 74 had an average of $609,230 in their retirement accounts in 2022, according to the Federal Reserve SCF. That compares with $537,560 among those 55 to 64, $462,410 among those 75 and older, $313,220 among those 45 to 54, $141,520 among those 35 to 44 and $49,130 among those younger than 35.
| Average retirement account balance by age | ||||||
| Year | Younger than 35 | 35 to 44 | 45 to 54 | 55 to 64 | 65 to 74 | 75 or older |
| 1989 | $21,120 | $68,590 | $120,460 | $143,660 | $113,490 | $76,010 |
| 1992 | $27,710 | $56,750 | $145,110 | $147,120 | $112,360 | $115,290 |
| 1995 | $36,500 | $69,040 | $169,120 | $181,640 | $162,290 | $114,930 |
| 1998 | $41,190 | $95,290 | $164,840 | $261,200 | $188,490 | $169,360 |
| 2001 | $31,580 | $108,610 | $212,860 | $332,180 | $292,980 | $212,370 |
| 2004 | $39,840 | $107,060 | $223,080 | $340,120 | $328,150 | $186,530 |
| 2007 | $35,740 | $114,650 | $219,850 | $387,020 | $382,060 | $151,130 |
| 2010 | $36,700 | $115,130 | $235,230 | $397,520 | $421,540 | $237,310 |
| 2013 | $36,770 | $143,210 | $222,840 | $362,770 | $563,870 | $302,400 |
| 2016 | $40,060 | $123,530 | $266,120 | $460,100 | $441,990 | $414,880 |
| 2019 | $34,970 | $152,960 | $295,270 | $473,440 | $493,900 | $414,900 |
| 2022 | $49,130 | $141,520 | $313,220 | $537,560 | $609,230 | $462,410 |
| Source: Federal Reserve SCF. | ||||||
- 62.2% of people ages 45 to 54, 61.5% of people ages 35 to 44, 57.0% of people ages 55 to 64, 51.0% of people 65 to 74, 49.6% of people younger than 35 and 42.0% of people 75 and older had retirement accounts in 2022, according to the Federal Reserve SCF.
- Americans 65 and older have an average credit card balance of $7,484 — 10.9% lower than the average balance among all consumers of $8,400, according to a 2024 LendingTree study. 19% of Americans 65 and older were employed in 2023, according to Pew Research Center.
Income
- Americans who earn $150,000 or more a year have an average Vanguard account balance of $336,470, according to Vanguard. That compares with those who earn $100,000 to $149,999 ($178,818), those who earn $75,000 to $99,999 ($106,875), those who earn $50,000 to $74,999 ($59,273), those who earn $30,000 to $49,999 ($25,096), those who earn less than $15,000 ($24,175) and those who earn $15,000 to $29,999 ($18,610).
- 84% of middle-class workers who earn $50,000 to $199,999 and are offered an employee-funded 401(k) or similar plan by their employers participate in the plan, according to the Transamerica Center for Retirement Studies. That breaks down to 87% who make $100,000 to $199,999 and 79% who make $50,000 to $99,999.
- 17% of the middle class frequently discuss saving, investing and retirement planning with family and friends, while 58% occasionally discuss it and 25% never discuss it, according to the Transamerica Center for Retirement Studies.
- The middle class's top three retirement fears are, according to the Transamerica Center for Retirement Studies, outliving their savings and investments (40%), declining health requiring long-term care (40%) and potential reductions in Social Security (39%).
- The top three retirement dreams for the middle class are traveling (67%), spending more time with family and friends (58%), and pursuing hobbies (51%), according to the Transamerica Center for Retirement Studies.
- 68% of American households making below $40,000 a year worry about not having enough for retirement, according to Gallup, compared with 60% of those with household incomes between $40,000 and $99,999 and 51% of those with household incomes of $100,000 and more.
Race
- 27.5% of Hispanic families had retirement accounts in 2022, versus 34.8% of Black families and 61.8% of white families, according to the Federal Reserve SCF.
- White Americans had an average of $380,330 in their retirement accounts in 2022, versus $120,320 among Hispanic Americans and $117,530 among Black Americans, according to the Federal Reserve SCF.
| Average retirement account balance by race | |||
| Year | White | Black | Hispanic |
| 1989 | $92,430 | $42,920 | $56,850 |
| 1992 | $98,970 | $40,660 | $32,290 |
| 1995 | $119,490 | $43,200 | $74,580 |
| 1998 | $147,540 | $58,630 | $83,160 |
| 2001 | $196,220 | $53,980 | $67,950 |
| 2004 | $214,870 | $93,840 | $62,130 |
| 2007 | $240,460 | $97,770 | $93,000 |
| 2010 | $264,390 | $72,150 | $89,290 |
| 2013 | $301,160 | $71,670 | $50,430 |
| 2016 | $321,810 | $92,170 | $118,690 |
| 2019 | $341,030 | $126,510 | $124,040 |
| 2022 | $380,330 | $117,530 | $120,320 |
| Source: Federal Reserve SCF. | |||
Gender
- The average Vanguard account balance among men ($157,489) is 40.1% higher than that among women ($112,401), according to Vanguard.
Industry
- Among 22 tracked industries, legal services employees had the highest average 401(k) balance in the second quarter of 2024 of $309,800, according to Fidelity. That’s ahead of petrochemical ($255,500) and energy production/distribution employees ($215,300). It’s lowest among retail trade ($52,700), health care excluding physician ($66,900) and real estate ($70,400) workers.
Retirement and Social Security
- 67.9 million people were receiving benefits from programs administered by the Social Security Administration (SSA) as of the end of June 2024, according to SSA.
- The average monthly payment to retired workers as of the end of June 2024 was $1,918, according to SSA.
| Average monthly payments | |
| Beneficiaries | Average monthly payment |
| Retired workers | $1,918 |
| Spouses | $911 |
| Children | $893 |
| Source: Social Security Administration (SSA). | |
- The maximum Social Security benefit at full retirement age in 2024 is $3,822, according to SSA.
- Retired workers and their dependents accounted for 77.8% of total benefits paid in 2023, according to SSA.
- The number of Americans 65 and older will increase from about 61 million in 2023 to about 77 million by 2035, according to SSA projections.
- 58% of retired Americans say they rely on Social Security as a major income source, compared with 35% of nonretirees who expect to do the same, according to Gallup.
- 91% of retirees in 2024 rely on Social Security as a source of income, ahead of personal retirement savings or investments (68%), according to EBRI.
- 43% of retirement income is expected to come from 401(k) plans, according to Charles Schwab, while 57% is projected to come from other sources such as Social Security, savings, pensions and part-time work.
Related: Best metros for early retirement
Retirement expectations or needs
- Over half of workers (56%) expect to retire at 65 or older, according to EBRI, but the majority of retirees (70%) report retiring earlier than age 65.
- Consumers need more than $1 million to retire with an average lifestyle in 147 of the 384 U.S. metros, according to a 2023 LendingTree study. San Francisco ($1,365,870), New York ($1,315,587) and San Diego ($1,298,796) top the list.
- 59% of Americans are very or moderately worried about not having enough money for retirement, according to Gallup.
- 50% of nonretirees believe that 401(k) or other retirement savings accounts will majorly fund their retirement, according to Gallup.
- 81% of employers say retirement savings and planning are extremely or very important to their workers, according to SHRM.
Retirement enrollment, withdrawals
- 59% of retirement plans in 2023 offered automatic enrollment, according to Vanguard, requiring participants to opt out if they don't want to enroll. That’s up from 58% in 2022 and 34% in 2013.
- 3.6% of plan participants initiated hardship withdrawals in 2023, according to Vanguard, up from 2.8% in 2022.
Related: Should you take a loan against your 401(k)?
Sources
- Charles Schwab 2024 401(k) participant study
- Fidelity Investments’ Q2 2024 retirement analysis
- Fidelity Investments’ Q2 2024 Building Financial Futures report
- Fidelity Investments’ Q2 2020 retirement analysis
- U.S. Census Bureau Survey of Income and Program Participation (SIPP)
- Employee Benefit Research Institute (EBRI) 2024 Retirement Confidence Study
- 2024 SHRM Employee Benefits Survey
- Federal Reserve Survey of Consumer Finances (SCF)
- Fidelity Investments’ 23rd annual Retiree Health Care Cost Estimate
- Fidelity Investments’ 22nd annual Retiree Health Care Cost Estimate
- Federal Reserve Economic Data (FRED)
- LendingTree
- Pew Research Center
- Centers for Disease Control and Prevention (CDC)
- Gallup 2024 Economic and Personal Finance survey
- Economic Innovation Group
- Vanguard How America Saves 2024 report
- Transamerica Center for Retirement Studies
- Social Security Administration (SSA)