 5 Easiest Bank Accounts to Open Online
 What Is Bank Fraud? How to Recognize It, Avoid It and Report It
 How to Open a Bank Account for a Minor
 How to Balance a Checkbook
The Data Around CD Early Withdrawal Penalties
In a previous article, we presented an overview of a commonly overlooked attribute on CDs, Early Withdrawal Penalties (EWPs). In it, we considered generally what EWPs are, why they matter, where to find them, and how they might be used to one’s advantage. We even discussed a couple of our proprietary tools that are useful for doing so. We now turn our attention to a more detailed look into the pertinent data surrounding EWPs in order to help provide important quantitative context for depositors as they seek to gauge how the EWPs on the products they’re researching stack up across each of the main CD product terms.
The Average EWP
In order to present a clearer and more complete picture of EWPs, we examined the EWP data from the 2,174 institutions and 10,868 products whose EWPs we are currently tracking. We focused our attention on a range of CDs from 6 Months to 5 Years in term length and began by analyzing the average EWP–measured in a particular number of days’ interest–for each term length. EWPs that could not be represented as a number of days' interest were not included (these complex EWPs were not common, representing only about 4% of the EWPs).
For each CD term, we extracted the average, lowest (best) 5th percentile, and highest (worst) 5th percentile in order to help depositors visualize what constitutes middle of the road vs. very good vs. very poor. The results are as follows:

As expected, the longer the CD term, the higher the EWP, on average. The 6 Month CD boasts the lowest average EWP, while the 5 Year CD has the highest. The disparity between the lowest (best) and highest (worst) 5th percentile confirms the wide range of potential EWPs, once again illustrating the need for their close consideration before choosing a product. For instance, the 5 Year CD carries an EWP of 90 days on the lower end and 540 days on the higher end, a 450-day variance, while the average EWP is 242 days. A consumer who blindly buys a 5 Year CD based on APY alone, then, could be met with a relatively expensive and unwanted surprise if the need to break the CD arises before maturity. The upper end of the EWP scale on the product could cost the consumer most, if not all, of the interest earned in the time leading up to breaking it. In many cases, the EWP might even dip into the principal.
How Does the Size and Type of Institution Correlate to EWPs?
While analyzing the EWP data, we thought it would be interesting to determine whether or not certain types or sizes of institutions were more apt to offer more saver-friendly EWPs, in general. We have previously researched the correlation between CD rates (APY) and bank size and the correlation between those same rates and the type of institution offering them, finding that better rates were offered by credit unions – especially larger ones – than banks, whose rates generally decreased as institution size grew larger.
We searched our data again according to the same criterion–institution size and type–to determine whether or not the best EWPs could be found in the same places. As it pertains to size, we grouped the institutions in the same manner as in the previous studies–small, medium, or large, where ‘small’ is any institution with less than one billion dollars in total assets, ‘medium’ is any institution with assets between one billion and twenty-five billion dollars, and ‘large’ is any institution with greater than twenty-five billion dollars in total assets. Below are the details from delving into both institution size and type:
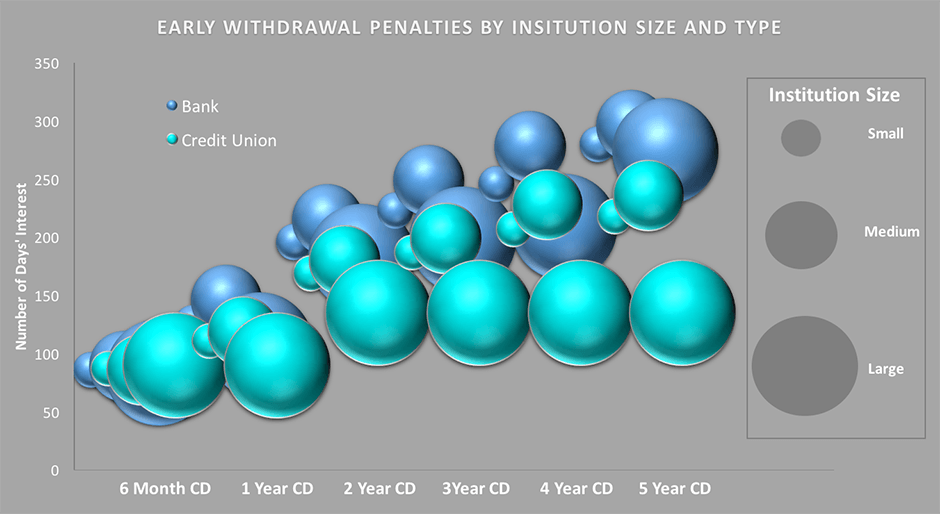
Some interesting findings present themselves from our dive into the data around the correlations between institution size/type and EWPs:
- We see that credit unions, represented by the lighter color, have more favorable (lower) EWPs on average than banks, strengthening their status as the (generally) more saver-friendly option in such areas.
- Interestingly, all sizes of banks showed an increase in average EWP as the term lengths increased. The smaller credit unions did, as well, but their largest counterparts began to level out with an average of 135 days across the board for the longer term length (2-5 Year) CD products.
- As it turns out, larger institutions-both banks and credit unions–have more favorable (lower) EWPs on average than their small- and medium-sized counterparts on at least four of the six CD products.
We also extended the analysis of institution type correlation one layer further by researching the EWPs of internet banks versus brick & mortar banks. Internet banks regularly offer higher APYs and lower fees on many of their products than do other banks, and we expected to find that they also offered more saver-friendly EWPs on average. However, our analysis of the data showed that their CD EWPs are actually a bit higher than their brick & mortar counterparts in all CD terms analyzed:
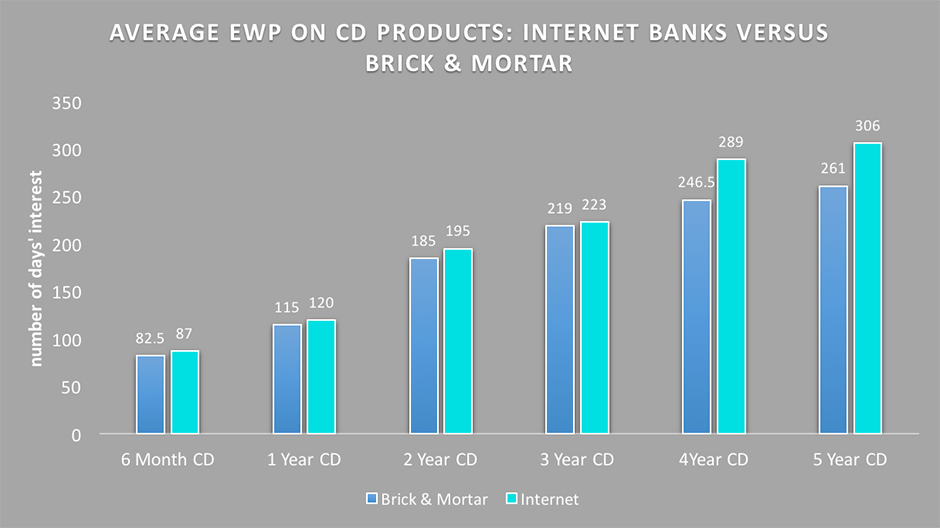
All things considered, that leaves credit unions, particularly the larger ones, as the clear leader when it comes to offering higher APY products with lower EWPs.
The Best Around
Pinpointing the overall best EWPs–by which, of course, we mean the lowest–can be tricky, because they are not necessarily one-to-one comparisons unless only one term length is considered. The same EWP on two different CD term lengths tells a completely different story for each one. Take, for instance, the lowest (best) 5th percentile EWP on a 6 Month CD and a 1 Year CD from the table above. The EWP is 30 days for both, which equates to almost 17% of the total interest to be earned on the 6 Month CD but just over 8% of the interest to be earned on a 1 Year CD. In order to draw out the comparison further, we examined the percentage that the average EWPs are of each product’s term length:
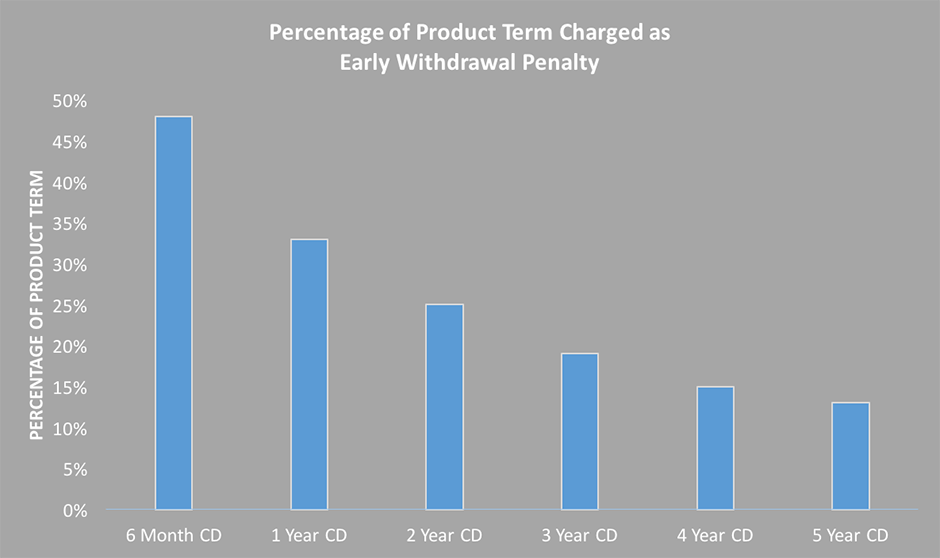
Taking percentages of the product term into account flips the previous chart backward. From this percentage-based perspective, the average EWP on 6 Month CDs is the harshest, and the EWP on 5 Year CDs is the mildest (assuming they are broken later in the term). Locating a product with such low EWPs and a healthy APY could prove very beneficial to the depositor who ends up choosing to break the CD prior to maturity.
Don’t Forget the APY!
In our previous introductory article, we made the case that APY should not be the singular consideration for a new CD product; EWPs must be considered. At this point in the conversation, however, with all of the talk about EWPs, it is important to turn our attention back to APYs. After all, a low EWP is not very helpful when the APY is also low, and most of our savvy readers are going to limit their CD choices to only those handful of CD products with the highest APYs for their respective terms.
To further understand how readily available (or not) these products are, we turned again to the data and examined how EWPs tend to stack up for the 1% of CD products boasting the highest APYs. Does an outsized APY on a CD product necessarily carry with it a significantly harsher EWP (thus relegating the ‘high APY, low EWP’ combination to the realm of the theoretical)? Here’s what the data shows:
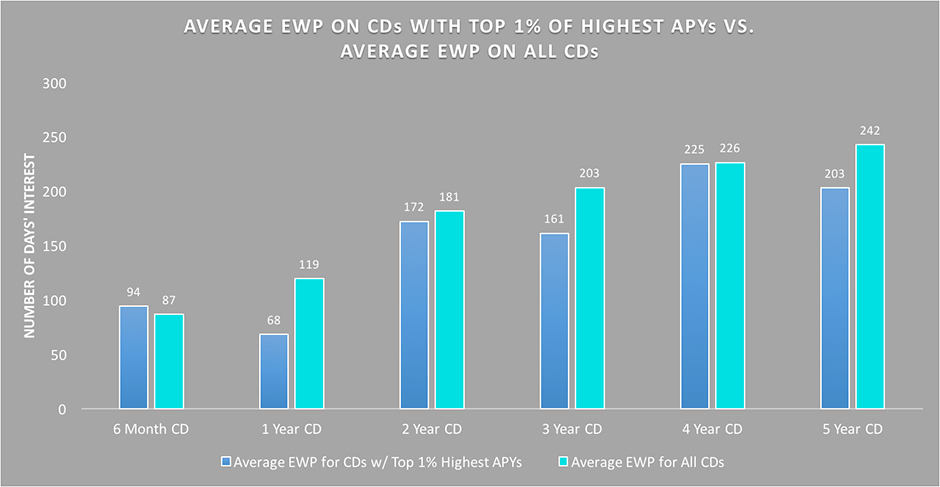
As the chart shows, the Highest APY products, for the most part, do not suffer from higher-than-average EWPs and, in fact, carry slightly lower EWPs than the average in most cases, which is great news for the savvy consumer.
As we explored in the previous article (and will flesh out further in the next), EWPs can make a surprisingly large difference in the yield of any CD broken before the maturity date. Considering the disparity in EWPs exhibited in the information above, consumers would be wise not to select a CD solely because it is a rate leader, especially in the case of longer-term CDs.
In part three of our series on EWPs, we’ll take the above research and data and dive further down into our database in search of some of the best APY/EWP combinations from specific institutions. Stay tuned!