 Financial Planner vs. Financial Advisor: Is There a Difference?
 Step-Up CDs: What They Are and How They Work
 What Is a Rollover IRA? Understanding Rollover Rules
 CD Early Withdrawal Penalty: Should You Pay It?
Best Places to Spend Your Golden Years: Top Metros Ranked by Lifestyle, Cost and Health Care
Retirement is your time to live life on your terms, but where you choose to settle down can drastically impact your dreams.
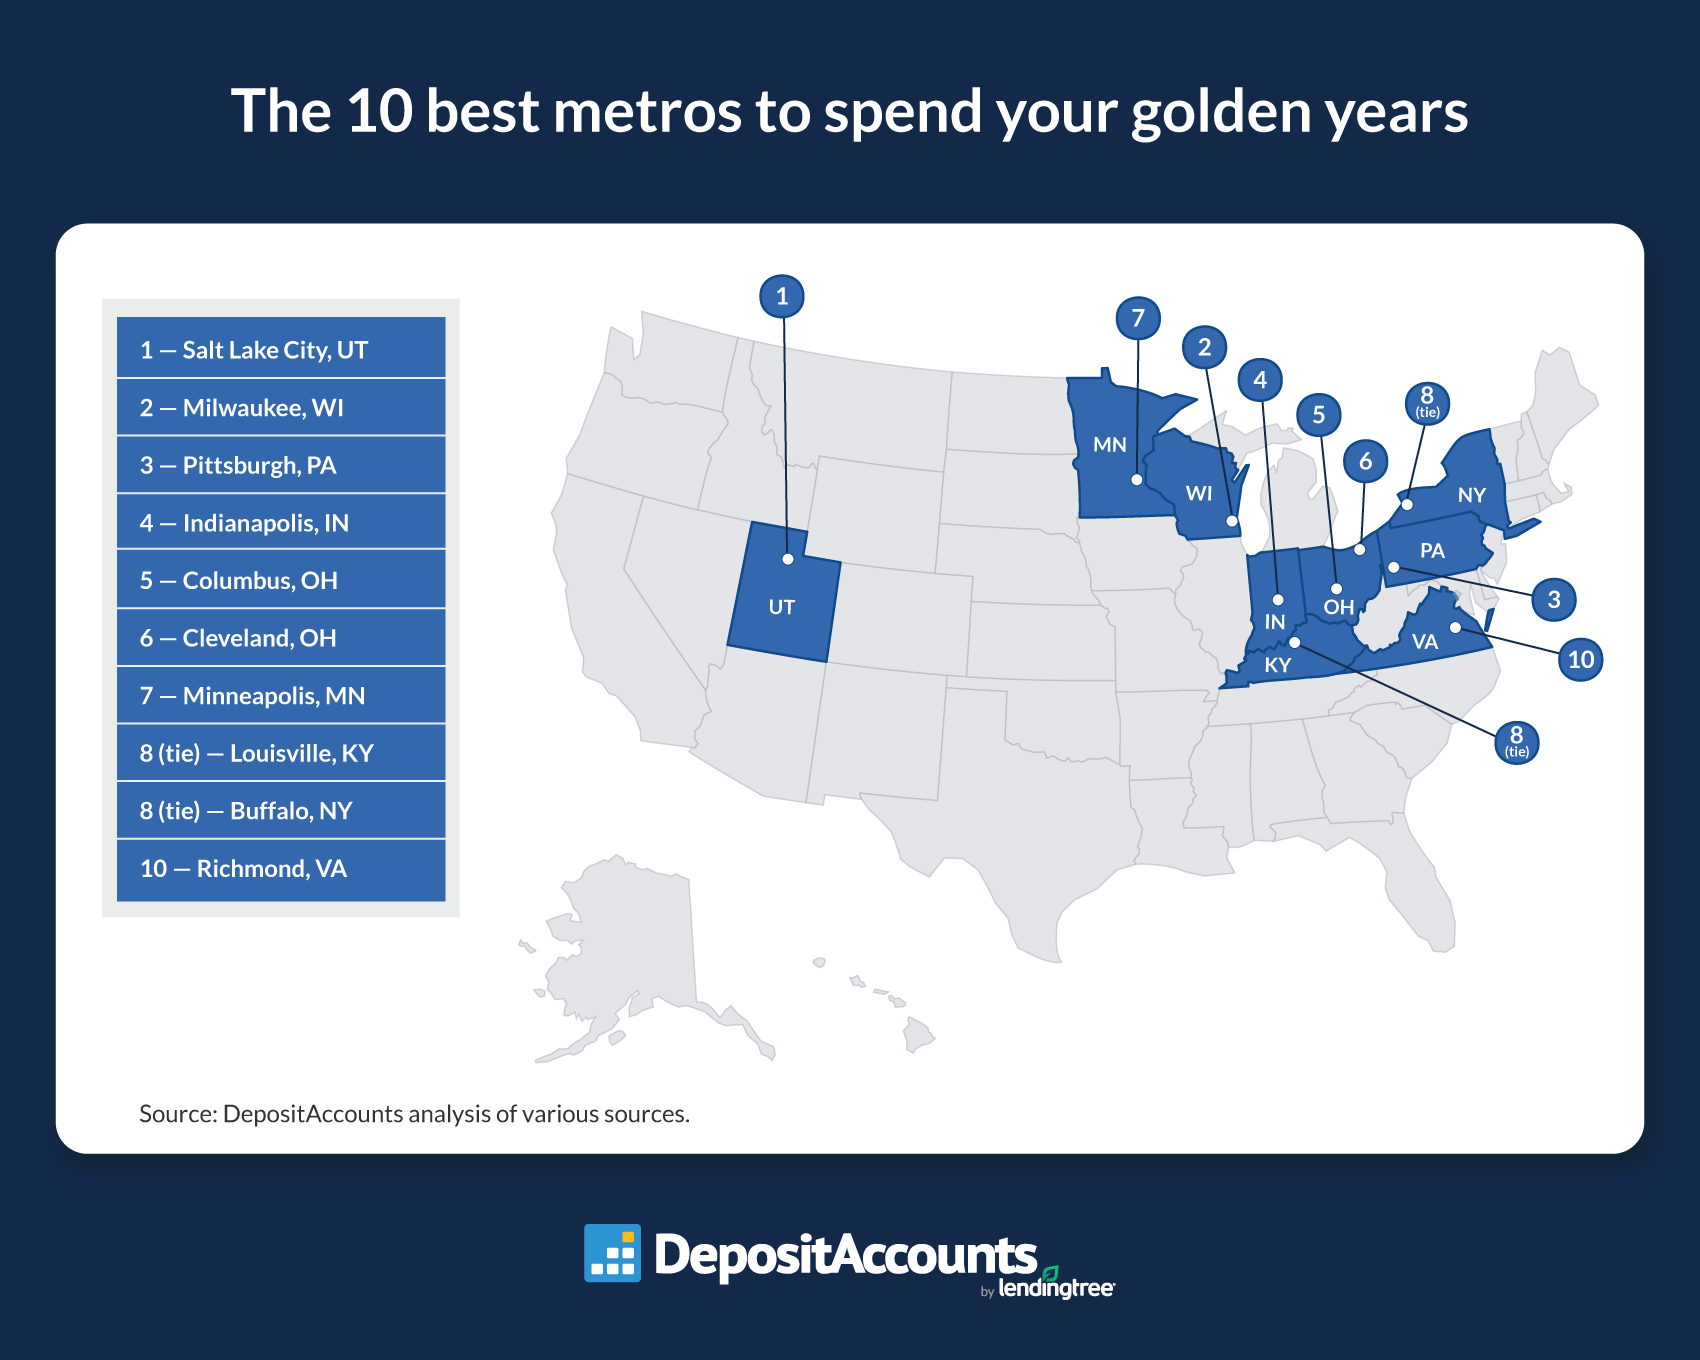
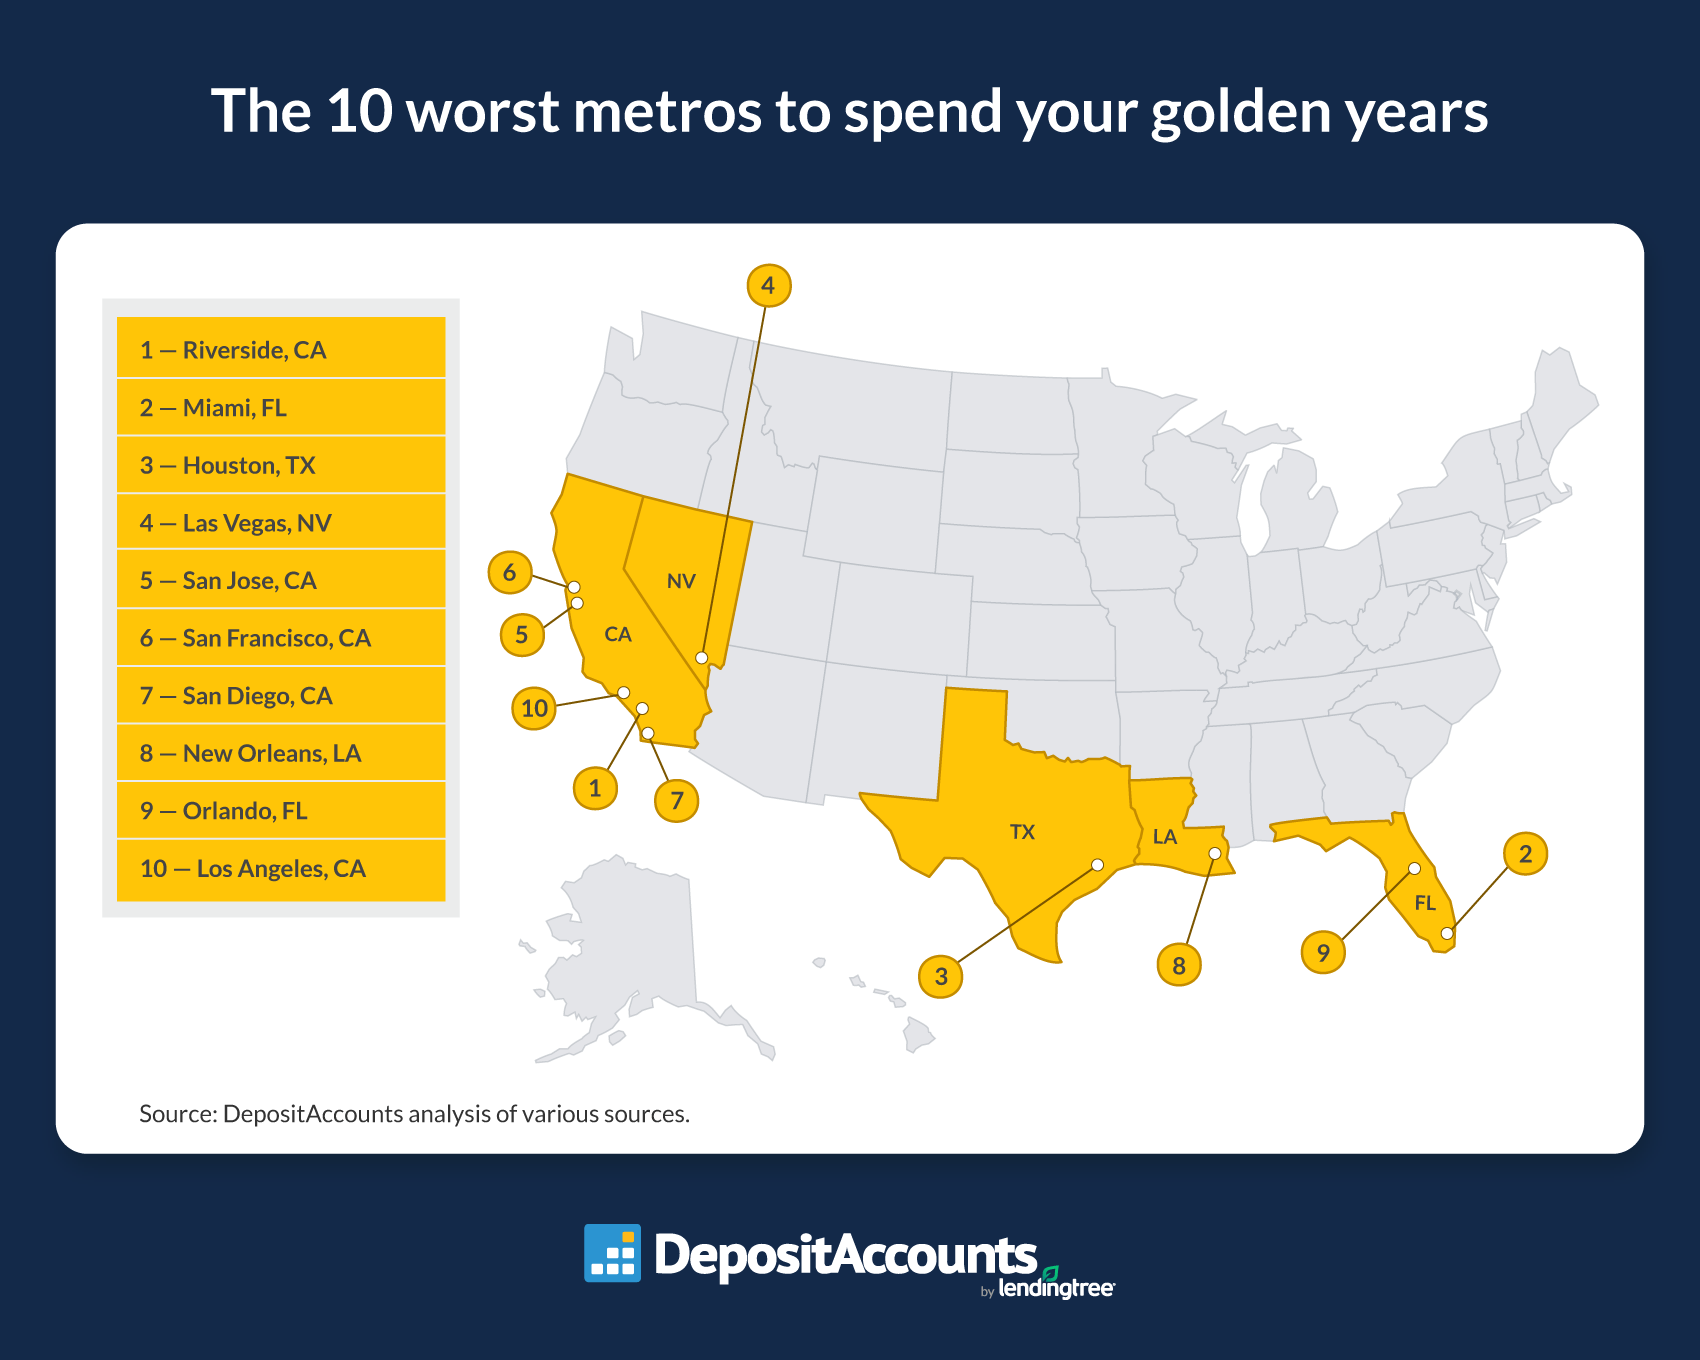
The newest DepositAccounts study looked at lifestyle, cost of living, medical quality and cost, and assisted care quality and availability to determine the best places to retire. Across the 50 largest metros, Salt Lake City ranks first and Riverside, Calif., ranks last.
Here’s what else we found.
Key findings
- Salt Lake City is the top choice for spending your golden years based on our analysis of lifestyle, cost of living, medical quality and cost, and assisted care quality and availability. Across the 50 largest U.S. metros, Salt Lake City has the lowest rate of preventable hospital stays (1,591 per 100,000 Medicare enrollees), while the state has the highest percentage of older adults who volunteer (44.2%). While it ranks third in lifestyle (behind Minneapolis and Denver), its overall strengths make it the best destination for retirees.
- Milwaukee and Pittsburgh rank second and third, respectively. Milwaukee is among the top five metros in our lifestyle category, offering excellent access to healthy food (rated 9.2 out of 10.0) and having a high percentage of physically active residents (82.2%). Meanwhile, Pittsburgh boasts the lowest median monthly housing costs ($996) and the lowest average health care costs per Medicare beneficiary ($10,639).
- California dominates the bottom of the list, with five of the 10 worst places to retire in the Golden State. Riverside ranks last, particularly because it has the lowest flu vaccination rate among Medicare enrollees (33.6%) and offers the lowest rate of arts, cultural and recreational facilities (21.1 per 100,000 residents). Other low-ranking California metros include San Jose (fifth-worst), San Francisco (sixth), San Diego (seventh) and Los Angeles (10th), with high costs of living a major factor.
- The Sunshine State is known for its appeal to retirees, but its metros didn’t perform well in our analysis. Among the largest Florida metros, Jacksonville ranks highest for retirees at 29th. Miami is the poorest-performing Florida metro at second to last, with the lowest medical quality and cost score of any metro.
What factors we considered
DepositAccounts researchers grouped data into four categories with various metrics:
For our lifestyle category, researchers analyzed the following:
- Food Environment Index (an indicator of access to healthy foods)
- Arts, cultural and recreational venues per 100,000 residents
- Percentage of adults 18 and older reporting physical activity
- Percentage of adults 65 and older reporting volunteerism in the past 12 months in each state
For cost of living:
- Median monthly housing costs
- Regional Price Parities for all items
For medical quality and cost:
- Preventable hospital stay rate (hospital stays for ambulatory-care-sensitive conditions per 100,000 Medicare enrollees, which might have been prevented if treated outpatient)
- Health care costs per Medicare beneficiary
- Percentage of fee-for-service (FFS) Medicare enrollees who had an annual flu vaccination
For assisted care availability and quality:
- Number of home health service providers per 100,000 residents
- Average quality of patient care star rating for home health agencies
- Continuing care retirement communities and assisted living facilities for the elderly per 100,000 residents
- Certified nursing home beds per 100,000 residents
- Average quality of patient care star rating for active nursing homes
Each category was scored individually by creating a relative value for each component, summing them together and dividing by the number of components. This created a highest possible score of 100 and a lowest possible score of zero. The sum of these four categorical scores was then divided by four to create the final score, with a highest possible score of 100 and a lowest possible score of zero.
Our analysis was limited to the largest 50 U.S. metros.
Salt Lake City is the best place to retire
When analyzing lifestyle, cost of living, medical quality and cost, and assisted care quality and availability factors across the 50 largest U.S. metros, Salt Lake City ranks first.
| The top 5 metros to retire | ||||||
| Rank | Metro | Lifestyle score | Cost-of-living score | Medical quality and cost score | Assisted care quality and availability score | Final score |
| 1 | Salt Lake City, UT | 66.7 | 78.1 | 74.4 | 40.0 | 64.8 |
| 2 | Milwaukee, WI | 63.3 | 87.6 | 71.2 | 35.1 | 64.3 |
| 3 | Pittsburgh, PA | 46.6 | 95.0 | 72.3 | 40.4 | 63.6 |
| 4 | Indianapolis, IN | 46.4 | 91.5 | 66.9 | 44.2 | 62.3 |
| 5 | Columbus, OH | 34.8 | 88.3 | 75.3 | 49.5 | 62.0 |
| Source: DepositAccounts analysis of various sources. | ||||||
Most notably, Salt Lake City has the lowest rate of preventable hospital stays at 1,591 per 100,000 Medicare enrollees.
| Metros with the lowest preventable hospital stay rates | ||
| Rank | Metro | Preventable hospital stay rate per 100,000 Medicare enrollees |
| 1 | Salt Lake City, UT | 1,591 |
| 2 | Denver, CO | 1,680 |
| 3 | Seattle, WA | 1,850 |
| 4 | San Jose, CA | 1,894 |
| 5 | San Francisco, CA | 1,946 |
| Source: DepositAccounts analysis of the 2024 County Health Rankings, using 2021 data. | ||
Good care is crucial, says Matt Schulz, LendingTree chief credit analyst and author of "Ask Questions, Save Money, Make More: How to Take Control of Your Financial Life.”
“If you don't have your health, everything gets exponentially more challenging, no matter how old you are,” he says. “The more you're able to preserve your health and steer clear of the need for hospital stays, the better. And that's not just about your physical health. It’s about your finances, too. There's little that's more expensive than bad health.”
Salt Lake City ties for the eighth-highest percentage of people who get physically active, at 81.0%. Looking at state factors, Utah has the highest rate of older adults who volunteer (44.2%).
| States with the highest percentage of older adults who volunteer | ||
| Rank | State | % of adults 65 and older reporting volunteerism |
| 1 | Utah | 44.2% |
| 2 | South Dakota | 39.6% |
| 3 | Wyoming | 39.2% |
| 4 | Vermont | 36.0% |
| 5 | Kansas | 34.9% |
| Source: DepositAccounts analysis of America's Health Rankings review of U.S. Census Bureau 2021 Current Population Survey Volunteering and Civic Life Supplement data. | ||
Across all four factors, its best-ranked score is in lifestyle, where it ranks third (behind Minneapolis and Denver). It also ranks sixth in medical quality and cost.
Milwaukee, Pittsburgh follow
After Salt Lake City, Milwaukee ranks second. Most notably, it’s among the top five metros in our lifestyle category. It’s tied for second for excellent access to healthy food (rated 9.2 out of 10.0), and it's fifth for its high percentage of physically active residents (82.2%).
| Metros with the highest Food Environment Index score | ||
| Rank | Metro | Food Environment Index score |
| 1 | Minneapolis, MN | 9.3 |
| 2 | Milwaukee, WI | 9.2 |
| 2 | San Jose, CA | 9.2 |
| 4 | Washington, DC | 9.1 |
| 4 | San Francisco, CA | 9.1 |
| Source: DepositAccounts analysis of the 2024 County Health Rankings, using 2019 and 2021 data. | ||
Meanwhile, Pittsburgh ranks third. More specifically, it has the lowest median monthly housing costs of any metro, at $996, and the lowest average health care costs per Medicare beneficiary ($10,639).
| Metros where housing is the least expensive | ||
| Rank | Metro | Median monthly housing costs |
| 1 | Pittsburgh, PA | $996 |
| 2 | Buffalo, NY | $1,005 |
| 3 | Cleveland, OH | $1,047 |
| 4 | Oklahoma City, OK | $1,067 |
| 5 | Birmingham, AL | $1,069 |
| Source: DepositAccounts analysis of the U.S. Census Bureau 2022 American Community Survey with five-year estimates. | ||
Overall, Pittsburgh has the sixth-best cost-of-living score and the eighth-highest medical quality and cost score.
California metros consistently rank low
Perhaps unsurprisingly given its high costs, California has five of the 10 worst metros to retire.
Riverside ranks last. This metro has the lowest flu vaccination rate among Medicare enrollees, at just 33.6%. It also offers the lowest rate of arts, cultural and recreational facilities (21.1 per 100,000 residents). The state also has the second-lowest percentage of older adults reporting volunteerism (15.2%).
| Metros with the lowest flu vaccination rates among Medicare enrollees | ||
| Rank | Metro | Flu vaccination rate |
| 1 | Riverside, CA | 33.6% |
| 2 | Las Vegas, NV | 35.0% |
| 3 | Miami, FL | 37.8% |
| 4 | New Orleans, LA | 38.4% |
| 5 | San Antonio, TX | 38.8% |
| Source: DepositAccounts analysis of the 2024 County Health Rankings, using 2021 data. | ||
Other low-ranking California metros include San Jose (fifth-worst), San Francisco (sixth), San Diego (seventh) and Los Angeles (10th). Of note, many California metros analyzed have the highest cost of living, with San Jose, San Francisco and San Diego ranking as the top three.
Additionally, San Jose has the highest median housing costs, at $2,845 — 91.4% higher than the average for the 50 largest metros ($1,486). That’s followed by San Francisco ($2,527) and San Diego ($2,157).
| Metros where housing is the most expensive | ||
| Rank | Metro | Median monthly housing costs |
| 1 | San Jose, CA | $2,845 |
| 2 | San Francisco, CA | $2,527 |
| 3 | San Diego, CA | $2,157 |
| 4 | Washington, DC | $2,089 |
| 5 | Boston, MA | $2,043 |
| Source: DepositAccounts analysis of the U.S. Census Bureau 2022 American Community Survey with five-year estimates. | ||
Despite their reputation, Florida metros rank poorly
Although Florida is well known for being a retirement haven, its metros didn’t perform well in our analysis. Among the largest 50 metros, Jacksonville is the highest-ranking Florida metro at just 29th.
Related: How much you’ll spend in your retirement years, by state
Miami is the poorest-performing Florida metro, at second to last. Overall, it has the lowest medical quality and cost score of any metro, particularly for its flu vaccination rate (37.8%, third-lowest), average health care costs per Medicare beneficiary ($14,228, third-highest) and preventable hospital stay rate (3,377 per 100,000 Medicare beneficiaries, fifth-highest).
| Metros with the highest average health care costs per Medicare beneficiary | ||
| Rank | Metro | Avg health care costs per Medicare beneficiary |
| 1 | Baltimore, MD | $14,363 |
| 2 | Los Angeles, CA | $14,308 |
| 3 | Miami, FL | $14,228 |
| 4 | Las Vegas, NV | $14,192 |
| 5 | Houston, TX | $14,151 |
| Source: DepositAccounts analysis of Centers for Medicare and Medicaid Services 2023 data. | ||
Medical care can be make or break for retirees, Schulz says.
“Quality medical care is a big deal for retirees,” he says. “We'd all like to think we'll always be healthy, but life happens. When it does, having good doctors and hospitals to go to matters a lot. Miami, Tampa and Orlando all rated poorly when it came to health care quality and cost, which was a big reason for them finishing among the 15 worst places on our list overall.”
Across all metros, Houston ranks third-worst
Beyond California and Florida, Texas also appears in the bottom three, with Houston ranking third-worst overall.
Despite ranking 24th in the cost-of-living category, Houston performs poorly in areas such as assisted care quality and availability, finishing second to last, just behind Raleigh, N.C.
Full rankings
| Top/worst metros to retire | ||||||
| Rank | Metro | Lifestyle score | Cost-of-living score | Medical quality and cost score | Assisted care quality and availability score | Final score |
| 1 | Salt Lake City, UT | 66.7 | 78.1 | 74.4 | 40.0 | 64.8 |
| 2 | Milwaukee, WI | 63.3 | 87.6 | 71.2 | 35.1 | 64.3 |
| 3 | Pittsburgh, PA | 46.6 | 95.0 | 72.3 | 40.4 | 63.6 |
| 4 | Indianapolis, IN | 46.4 | 91.5 | 66.9 | 44.2 | 62.3 |
| 5 | Columbus, OH | 34.8 | 88.3 | 75.3 | 49.5 | 62.0 |
| 6 | Cleveland, OH | 36.8 | 95.1 | 57.8 | 56.1 | 61.5 |
| 7 | Minneapolis, MN | 71.8 | 64.2 | 75.6 | 29.0 | 60.2 |
| 8 | Louisville, KY | 31.7 | 95.6 | 60.3 | 46.6 | 58.6 |
| 8 | Buffalo, NY | 39.7 | 94.7 | 62.8 | 37.2 | 58.6 |
| 10 | Richmond, VA | 45.8 | 77.8 | 72.2 | 35.1 | 57.7 |
| 11 | St. Louis, MO | 43.9 | 86.2 | 60.3 | 40.0 | 57.6 |
| 12 | Cincinnati, OH | 33.5 | 92.1 | 54.9 | 47.5 | 57.0 |
| 13 | Denver, CO | 70.9 | 48.0 | 75.6 | 32.4 | 56.7 |
| 14 | Kansas City, MO | 37.4 | 92.1 | 57.1 | 39.1 | 56.4 |
| 14 | Nashville, TN | 46.8 | 80.4 | 60.6 | 37.9 | 56.4 |
| 14 | Raleigh, NC | 48.2 | 74.9 | 81.3 | 21.0 | 56.4 |
| 17 | Portland, OR | 57.7 | 48.3 | 73.4 | 40.9 | 55.1 |
| 18 | Charlotte, NC | 42.4 | 82.1 | 62.6 | 28.9 | 54.0 |
| 19 | Virginia Beach, VA | 46.2 | 75.1 | 63.9 | 28.2 | 53.4 |
| 19 | Detroit, MI | 44.0 | 87.0 | 41.4 | 41.2 | 53.4 |
| 19 | Hartford, CT | 55.2 | 59.7 | 55.2 | 43.4 | 53.4 |
| 22 | Seattle, WA | 62.0 | 30.9 | 78.0 | 41.8 | 53.2 |
| 23 | Oklahoma City, OK | 27.0 | 97.8 | 55.2 | 31.2 | 52.8 |
| 24 | Providence, RI | 51.5 | 64.5 | 54.2 | 39.9 | 52.5 |
| 25 | Philadelphia, PA | 48.9 | 69.5 | 51.4 | 38.3 | 52.0 |
| 26 | San Antonio, TX | 24.5 | 85.9 | 55.5 | 34.9 | 50.2 |
| 27 | Austin, TX | 37.5 | 67.8 | 59.1 | 36.1 | 50.1 |
| 28 | Baltimore, MD | 48.3 | 62.4 | 45.3 | 41.6 | 49.4 |
| 29 | Jacksonville, FL | 29.9 | 78.2 | 42.0 | 46.0 | 49.0 |
| 30 | Washington, DC | 62.0 | 32.8 | 66.7 | 30.0 | 47.9 |
| 31 | Boston, MA | 64.2 | 32.8 | 59.6 | 33.6 | 47.6 |
| 31 | Phoenix, AZ | 30.2 | 65.8 | 60.4 | 34.0 | 47.6 |
| 33 | Birmingham, AL | 10.3 | 98.1 | 41.9 | 38.7 | 47.3 |
| 34 | Memphis, TN | 4.4 | 95.7 | 59.9 | 28.5 | 47.1 |
| 35 | Atlanta, GA | 30.5 | 73.6 | 60.1 | 22.3 | 46.6 |
| 35 | Chicago, IL | 40.9 | 59.7 | 50.5 | 35.4 | 46.6 |
| 37 | Tampa, FL | 27.4 | 76.6 | 28.2 | 45.7 | 44.5 |
| 38 | Sacramento, CA | 43.7 | 44.7 | 51.3 | 34.6 | 43.6 |
| 39 | New York, NY | 47.8 | 34.3 | 45.6 | 44.3 | 43.0 |
| 40 | Dallas, TX | 30.9 | 63.4 | 42.8 | 34.4 | 42.9 |
| 41 | Los Angeles, CA | 47.6 | 31.0 | 35.8 | 54.7 | 42.3 |
| 42 | Orlando, FL | 28.7 | 70.7 | 29.5 | 36.8 | 41.4 |
| 43 | New Orleans, LA | 5.9 | 91.8 | 41.0 | 25.9 | 41.2 |
| 44 | San Diego, CA | 52.1 | 25.0 | 46.3 | 38.7 | 40.5 |
| 45 | San Francisco, CA | 58.1 | 8.6 | 51.0 | 39.9 | 39.4 |
| 46 | San Jose, CA | 50.1 | 4.9 | 59.5 | 39.3 | 38.5 |
| 47 | Las Vegas, NV | 29.9 | 78.9 | 17.8 | 26.5 | 38.3 |
| 48 | Houston, TX | 20.0 | 75.4 | 29.7 | 21.9 | 36.8 |
| 49 | Miami, FL | 38.8 | 46.1 | 16.9 | 43.7 | 36.4 |
| 50 | Riverside, CA | 23.9 | 52.0 | 26.3 | 26.8 | 32.3 |
| Source: DepositAccounts analysis of various sources. | ||||||
Picking a place to retire: Top expert tips
While being near grandchildren or finding a good retirement community may be your top priorities for your golden years, you shouldn’t ignore these important lifestyle, care and financial factors. As you consider a place to retire — maybe even early retirement — Schulz recommends the following:
- Cheaper doesn't always mean better. “It can be tempting to move to a place with a super-cheap cost of living for your golden years,” he says. “However, while money matters, it isn't the only thing. Things like quality health care, social opportunities, arts and culture, and temperate climate all matter, too. So does proximity to family and friends. There are many other factors. What’s most important is a question of personal preference, of course, but thinking through what matters most to you can help you make sure you end up in the right place.”
- People need people. “Don't underestimate the importance of staying social as you get older,” he says. “Having family and longtime friends around is a big deal and can have a real, tangible impact on your health, finances and almost every other aspect of your life. However, meeting new people and having new experiences is important, too. That doesn't mean you should move someplace far away or super-expensive in search of new, fun experiences, but you shouldn't discount the need for those things either.”
- Cushion your savings more than you think. With inflation still higher than hoped, consider opening a high-yield savings account to grow your emergency fund. Additionally, make sure your checking account can be linked to a reliable source of monthly income, like Social Security or a pension.
Methodology
DepositAccounts researchers grouped various data into four categories with various metrics:
Lifestyle
- Food Environment Index. This is an indicator of access to healthy foods, with 0.0 the worst and 10.0 the best. (2024 County Health Rankings, using 2019 and 2021 data)
- Arts, cultural and recreational venues per 100,000 residents. NAICS codes 7111 (performing arts companies), 7112 (spectator sports), 7121 (museums, historical sites and similar institutions), 7131 (amusement parks and arcades) and 7139 (other amusement and recreation industries) were used to identify arts, cultural and recreation establishments. (U.S. Census Bureau 2022 County Business Patterns)
- Percentage of adults 18 and older reporting physical activity. We calculated the inverse of the percentage of adults 18 and older who reported no leisure-time physical activity. (2024 County Health Rankings, using 2021 data)
- Percentage of adults 65 and older reporting volunteerism in the past 12 months in each state. (America's Health Rankings analysis of U.S. Census Bureau 2021 Current Population Survey Volunteering and Civic Life Supplement data)
Cost of living
- Median monthly housing costs. (U.S. Census Bureau 2022 American Community Survey with five-year estimates)
- Regional Price Parities for all items. (U.S. Bureau of Economic Analysis, 2022)
Medical quality and cost
- Preventable hospital stay rate. These are hospital stays for ambulatory-care-sensitive conditions per 100,000 Medicare enrollees. They might have been prevented if treated outpatient. (2024 County Health Rankings, using 2021 data)
- Health care costs per Medicare beneficiary. (Centers for Medicare and Medicaid Services county-level aggregate expenditure and risk score data on assignable beneficiaries, 2023)
- Percentage of fee-for-service (FFS) Medicare enrollees who had an annual flu vaccination. (2024 County Health Rankings, using 2021 data)
Assisted care availability and quality
- Number of home health service providers per 100,000 residents. (Centers for Medicare and Medicaid Services Home Health Care Agencies database, released Oct. 23, 2024, and issued Sept. 18, 2024)
- Average quality of patient care star rating for home health agencies. This is a rating of 1.0 to 5.0, in increments of 0.5. (Centers for Medicare and Medicaid Services Home Health Care Agencies database, released in October 2024)
- Continuing care retirement communities and assisted living facilities for the elderly per 100,000 residents. NAICS codes 623311 (continuing care retirement communities) and 623312 (assisted living facilities for the elderly) were used. (U.S. Census Bureau 2022 County Business Patterns)
- Certified nursing home beds per 100,000 residents. (Centers for Medicare and Medicaid Services Provider Information database, released in October 2024)
- Average quality of patient care star rating for active nursing homes. This is a rating of 1.0 to 5.0, in increments of 0.5. (Centers for Medicare and Medicaid Services Provider Information database, released in October 2024)
The data was aggregated to the metropolitan statistical area (MSA) level and limited to the 50 largest MSAs by population. Analysts used the U.S. Census Bureau 2022 American Community Survey with five-year population estimates.
Each category was scored individually by creating a relative value for each component, summing them together and dividing by the number of components. This created a highest possible score of 100 and a lowest possible score of zero. The sum of these four categorical scores was then divided by four to create the final score, with a highest possible score of 100 and a lowest possible score of zero.